

【测试】 FIO:ceph/磁盘IO测试工具 fio(iodepth深度)
目录
作者:bandaoyu本文随时更新,地址:https://blog.csdn.net/bandaoyu/article/details/113190057
随看随用
NAS文件系统测试
随机读 IOPS/吞吐-4K
fio -numjobs=1 -iodepth=128 -direct=1 -ioengine=libaio -sync=1 -rw=randread -bs=4K -size=1G -time_based -runtime=60 -name=Fio -directory=/mnt
随机写 IOPS/吞吐-4K
fio -numjobs=1 -iodepth=128 -direct=1 -ioengine=libaio -sync=1 -rw=randwrite -bs=4K -size=1G -time_based -runtime=60 -name=Fio -directory=/mnt
混合读写测试
随机混合读写 IOPS/吞吐-4K
fio -numjobs=1 -iodepth=128 -direct=1 -ioengine=libaio -sync=1 -rw=randrw -bs=4K -size=1G -time_based -runtime=60 -name=Fio -directory=/mnt
顺序混合读写 IOPS/吞吐-4K
fio -numjobs=1 -iodepth=128 -direct=1 -ioengine=libaio -sync=1 -rw=rw -bs=4K -size=1G -time_based -runtime=60 -name=Fio -directory=/mnt
块系统测试
fio --ioengine=rbd --iodepth=10 --numjobs=1 --pool=.rbdpool.rbd --rbdname=lun14 --name=write5 -rw=randwrite --bs=1M --size=6G --group_reporting --direct=1
测试盘:
随机读:
fio -ioengine=libaio -group_reporting -direct=1 -name=testsda -numjobs=1 --time_based --runtime=1800 -iodepth=64 -rw=randread -bs=512k -filename=/dev/sda
(filename=/dev/sda 指定被测试的盘符)
FIO用法
随机读:(可直接用,向磁盘写一个2G文件,10线程,随机读1分钟,给出结果)
fio -filename=/tmp/test_randread -direct=1 -iodepth 1 -thread -rw=randread -ioengine=psync -bs=16k -size=2G -numjobs=10 -runtime=60 -group_reporting -name=mytest
说明:
官网选项说明:https://fio.readthedocs.io/en/latest/fio_doc.html#command-line-options
说明文档:https://fio.readthedocs.io/en/latest/fio_doc.html
https://linux.die.net/man/1/fio
PDF:https://download.csdn.net/download/bandaoyu/23481652
没有列出的参数看:https://www.systutorials.com/docs/linux/man/1-fio/

filename=/dev/emcpowerb 支持文件系统或者裸设备,-filename=/dev/sda2或-filename=/dev/sdb
direct=1                 测试过程绕过机器自带的buffer,使测试结果更真实
iodepth=1                如果 I/O 引擎是异步的,我们希望保持多大的队列深度?
rw=randwread             测试随机读的I/O
rw=randwrite             测试随机写的I/O
rw=randrw                测试随机混合写和读的I/O
rw=read                  测试顺序读的I/O
rw=write                 测试顺序写的I/O
rw=rw                    测试顺序混合写和读的I/O
bs=4k                    单次io的块文件大小为4k
bsrange=512-2048         同上,提定数据块的大小范围
size=5g                  本次的测试文件大小为5g,以每次4k的io进行测试
numjobs=30               本次的测试线程为30
runtime=1000             测试时间为1000秒,如果不写则一直将5g文件分4k每次写完为止
time_based: 如果在runtime指定的时间还没到时文件就被读写完成,将继续重复直到runtime时间结束。
ioengine=psync           io引擎使用pync方式,如果要使用libaio引擎,需要yum install libaio-devel包
rwmixwrite=30            在混合读写的模式下,写占30%
group_reporting          关于显示结果的,汇总每个进程的信息
此外
lockmem=1g               只使用1g内存进行测试
zero_buffers             用0初始化系统buffer
nrfiles=8                每个进程生成文件的数量

--ioengine=rbd表示用rbd引擎
--pool为存储卷所在的存储池,一般为“.硬盘池名.rbd” (H3C),
--rbdname为存储卷名,其他参数与fio跑普通卷无差异

https://fio.readthedocs.io/en/latest/fio_doc.html
io总的输入输出量
bw:带宽 KB/s
iops:每秒钟的IO数
runt:总运行时间
lat (msec):延迟(毫秒)
msec: 毫秒
usec: 微秒
如果你开始部署集群时没有创建存储池, Ceph 会用默认存储池 rbd 存数据。
顺序读:
fio -filename=/dev/sdb1 -direct=1 -iodepth 1 -thread -rw=read -ioengine=psync -bs=16k -size=2G -numjobs=10 -runtime=60 -group_reporting -name=mytest
随机写:
fio -filename=/dev/sdb1 -direct=1 -iodepth 1 -thread -rw=randwrite -ioengine=psync -bs=16k -size=2G -numjobs=10 -runtime=60 -group_reporting -name=mytest
顺序写:
fio -filename=/dev/sdb1 -direct=1 -iodepth 1 -thread -rw=write -ioengine=psync -bs=16k -size=2G -numjobs=10 -runtime=60 -group_reporting -name=mytest
混合随机读写:
fio -filename=/dev/sdb1 -direct=1 -iodepth 1 -thread -rw=randrw -rwmixread=70 -ioengine=psync -bs=16k -size=2G -numjobs=10 -runtime=60 -group_reporting -name=mytest -ioscheduler=noop
测试场景:

  100%随机,100%读, 4K
  fio -filename=/dev/emcpowerb -direct=1 -iodepth 1 -thread -rw=randread -ioengine=psync -bs=4k -size=1000G -numjobs=50 -runtime=180 -group_reporting -name=rand_100read_4k

  100%随机,100%写, 4K
  fio -filename=/dev/emcpowerb -direct=1 -iodepth 1 -thread -rw=randwrite -ioengine=psync -bs=4k -size=1000G -numjobs=50 -runtime=180 -group_reporting -name=rand_100write_4k

  100%顺序,100%读 ,4K
  fio -filename=/dev/emcpowerb -direct=1 -iodepth 1 -thread -rw=read -ioengine=psync -bs=4k -size=1000G -numjobs=50 -runtime=180 -group_reporting -name=sqe_100read_4k

  100%顺序,100%写 ,4K
  fio -filename=/dev/emcpowerb -direct=1 -iodepth 1 -thread -rw=write -ioengine=psync -bs=4k -size=1000G -numjobs=50 -runtime=180 -group_reporting -name=sqe_100write_4k

  100%随机,70%读,30%写 4K
fio -filename=/dev/emcpowerb -direct=1 -iodepth 1 -thread -rw=randrw -rwmixread=70 -ioengine=psync -bs=4k -size=1000G -numjobs=50 -runtime=180 -group_reporting -name=randrw_70read_4k原文:linux FIO命令详解(一):https://blog.csdn.net/don_chiang709/article/details/92628623
FIO介绍
官网:https://fio.readthedocs.io/
FIO是测试IOPS的非常好的工具,用来对磁盘进行压力测试和验证。磁盘IO是检查磁盘性能的重要指标,可以按照负载情况分成照顺序读写,随机读写两大类。
FIO是一个可以产生很多线程或进程并执行用户指定的特定类型I/O操作的工具,IO 是一个多线程io生成工具,可以生成多种IO模式,用来测试磁盘设备的性能(也包含文件系统:如针对网络文件系统 NFS 的IO测试)。
fio在github上的坐标:https://fio.readthedocs.io/ 。
查看当前 fio 已支持的 IO 引擎
# fio --enghelp
Available IO engines:
	cpuio
	mmap
	sync
	psync
	vsync
	pvsync
	null
	net
	netsplice
	libaio
	rdma
	posixaio
	falloc
	e4defrag
	splice
	rbd
	mtd
	sg
	binject
fio 使用 rbd IO 引擎后,它会读取 /etc/ceph/ceph.conf 中的配置去连接 Ceph 集群。
FIO 工具常用参数:
https://blog.csdn.net/get_set/article/details/108001674
参数说明:
filename=/dev/sdb1 测试文件名称,通常选择需要测试的盘的data目录。
direct=1 是否使用directIO,测试过程绕过OS自带的buffer,使测试磁盘的结果更真实。Linux读写的时候,内核维护了缓存,数据先写到缓存,后面再后台写到SSD。读的时候也优先读缓存里的数据。这样速度可以加快,但是一旦掉电缓存里的数据就没了。所以有一种模式叫做DirectIO,跳过缓存,直接读写SSD。
rw=randwrite 测试随机写的I/O
rw=randrw 测试随机写和读的I/O
bs=16k 单次io的块文件大小为16k
bsrange=512-2048 同上,提定数据块的大小范围
size=5G 每个线程读写的数据量是5GB。
numjobs=1 每个job(任务)开1个线程,这里=几个,后面每个用-name指定的任务就开几个线程测试。所以最终线程数=任务数(几个name=jobx)* numjobs。
name=job1:一个任务的名字,重复了也没关系。如果fio -name=job1 -name=job2,建立了两个任务,共享-name=job1之前的参数。-name之后的就是job2任务独有的参数。
thread 使用pthread_create创建线程,另一种是fork创建进程。进程的开销比线程要大,一般都采用thread测试。fio默认会使用fork()创建job,如果这个选项设置的话,fio将使用pthread_create来创建线程。
runtime=1000 测试时间为1000秒,如果不写 则一直将5g文件分4k每次写完为止。
ioengine=libaio 指定io引擎使用libaio方式。libaio:Linux本地异步I/O。请注意,Linux可能只支持具有非缓冲I/O的排队行为(设置为“direct=1”或“buffered=0”);rbd:通过librbd直接访问CEPH Rados
iodepth=16 涉及到 NCQ(Native Command Queueing,本地命令队列)技术的知识,一些存储磁盘的IO口的协议支持NCQ ,如果NCQ最大深度为 32,则使用 fio 进行性能测试时,其 iodepth不得超过 32;
在异步模式下,CPU不能一直无限的发命令到SSD。比如SSD执行读写如果发生了卡顿,那有可能系统会一直不停的发命令,几千个,甚至几万个,这样一方面SSD扛不住,另一方面这么多命令会很占内存,系统也要挂掉了。这样,就带来一个参数叫做队列深度。(详细的见后面的章节:《fio的iodepth参数说明》)
Block Devices(RBD),无需使用内核RBD驱动程序(rbd.ko)。该参数包含很多ioengine,如:libhdfs/rdma等
rwmixwrite=30 在混合读写的模式下,写占30%
group_reporting
如果‘numjobs’设置的话,我们感兴趣的可能是打印group的统计值,而不是一个单独的job。这在‘numjobs’的值很大时,一般是设置为true的,可以减少输出的信息量。如果‘group_reporting’设置的话,fio将会显示最终的per-groupreport而不是每一个job都会显示。
此外
lockmem=1g 只使用1g内存进行测试。
zero_buffers 用0初始化系统buffer。
nrfiles=8 每个进程生成文件的数量。
a.loops=int
重复运行某个job多次,默认是1。
loops与runtime是两个不能同时存在的两个参数,loops主要是定义硬盘执行的圈数,而runtime只是定义fio执行的时间。
b.time_based
如果设置的话,即使file已被完全读写或写完,也要执行完runtime规定的时间。它是通过循环执行相同的负载来实现的,与runtime相对应。
c.ramp_time=time
设定在记录任何性能信息之前要运行特定负载的时间。这个用来等性能稳定后,再记录日志结果,因此可以减少生成稳定的结果需要的运行时间。
d.randrepeat=bool
对于随机IO负载,配置生成器的种子,使得路径是可以预估的,使得每次重复执行生成的序列是一样的。
磁盘读写常用测试点:
1. Read=100% Ramdon=100% rw=randread (100%随机读)
2.Write=100% Ramdon=100% rw=randwrite (100%随机写)
3. Read=100% Sequence=100% rw=read (100%顺序读)
4.Write=100% Sequence=100% rw=write (100%顺序写)
5. Read=70% Sequence=100% rw=rw, rwmixread=70, rwmixwrite=30
(70%顺序读,30%顺序写)
6. Read=70% Ramdon=100% rw=randrw, rwmixread=70, rwmixwrite=30
(70%随机读,30%随机写)
fio例子:
fio --ioengine=rbd --iodepth=10 --numjobs=1 --pool=.rbdpool.rbd --rbdname=lun14 --name=write5 --rw=randwrite --bs=1M --size=6G --group_reporting --direct=1&
[root@rdma63 hsx]# write5: (g=0): rw=randwrite, bs=1M-1M/1M-1M/1M-1M, ioengine=rbd, iodepth=10
fio-2.2.10
Starting 1 process
rbd engine: RBD version: 1.12.0
Jobs: 1 (f=0): [w(1)] [100.0% done] [0KB/109.3MB/0KB /s] [0/109/0 iops] [eta 00m:00s]
write5: (groupid=0, jobs=1): err= 0: pid=4074401: Wed Jan 27 10:17:15 2021
write: io=6144.0MB, bw=108918KB/s, iops=106, runt= 57763msec
slat (usec): min=254, max=20470, avg=512.86, stdev=635.57
clat (msec): min=14, max=273, avg=91.68, stdev=32.76
lat (msec): min=15, max=274, avg=92.20, stdev=32.76
clat percentiles (msec):
| 1.00th=[ 37], 5.00th=[ 49], 10.00th=[ 55], 20.00th=[ 64],
| 30.00th=[ 71], 40.00th=[ 79], 50.00th=[ 87], 60.00th=[ 95],
| 70.00th=[ 106], 80.00th=[ 121], 90.00th=[ 139], 95.00th=[ 151],
| 99.00th=[ 182], 99.50th=[ 194], 99.90th=[ 233], 99.95th=[ 269],
| 99.99th=[ 273]
bw (KB /s): min=58810, max=138686, per=100.00%, avg=109173.18, stdev=10441.08
lat (msec) : 20=0.03%, 50=6.04%, 100=58.74%, 250=35.11%, 500=0.08%
cpu : usr=4.28%, sys=1.12%, ctx=920, majf=0, minf=272282
IO depths : 1=2.9%, 2=12.6%, 4=43.1%, 8=41.5%, 16=0.0%, 32=0.0%, >=64=0.0%
submit : 0=0.0%, 4=100.0%, 8=0.0%, 16=0.0%, 32=0.0%, 64=0.0%, >=64=0.0%
complete : 0=0.0%, 4=90.1%, 8=5.5%, 16=4.5%, 32=0.0%, 64=0.0%, >=64=0.0%
issued : total=r=0/w=6144/d=0, short=r=0/w=0/d=0, drop=r=0/w=0/d=0
latency : target=0, window=0, percentile=100.00%, depth=10Run status group 0 (all jobs):
WRITE: io=6144.0MB, aggrb=108918KB/s, minb=108918KB/s, maxb=108918KB/s, mint=57763msec, maxt=57763msecDisk stats (read/write):
sdq: ios=0/1805, merge=0/52, ticks=0/77, in_queue=76, util=0.11%
FIO结果说明
FIO会为每个Job打印统计信息。 最后面是合计的数值。我们一般看重的是总的性能和延迟。
bw=平均IO带宽
io=执行了多少M的IO
iops=IOPS
runt=线程运行时间
延迟Latency。Slat是发命令时间(submission latency),clat是命令执行时间(complete latency),lat就是总的延迟。clat percentiles (usec)给出了延迟的统计分布。
slat=提交延迟,是提交io到内核的延迟。(即从fio到内核的时长)
clat=完成延迟, 内核到磁盘完成之间的延迟。(即内核收到指令后读写磁盘所花的时间)
lat=是总延迟,lat=slat+clat(异步的时候)
slat通常是比较稳定的值,所以这里通过观察clat来判断IO延迟情况。
(对同步 I/O 来说,由于 I/O 提交和 I/O 完成是一个动作,所以 slat 实际上就是 I/O 完成的时间,而 clat 是 0。而从示例可以看到,使用异步 I/O(libaio)时,lat 近似等于 slat + clat 之和)
cpu=利用率
IO depths=io队列
IO submit=单个IO提交要提交的IO数
IO complete=Like the above submit number, but for completions instead.
IO issued=The number of read/write requests issued, and how many of them were short.
IO latencies=IO完延迟的分布
aggrb=group总带宽
minb=最小.平均带宽.
maxb=最大平均带宽.
mint=group中线程的最短运行时间.
maxt=group中线程的最长运行时间.
ios=所有group总共执行的IO数.
merge=总共发生的IO合并数.
ticks=Number of ticks we kept the disk busy.
io_queue=花费在队列上的总共时间.
util=磁盘利用率
fio 有很多测试任务配置文件,在git工程 examples 文件夹中,我们可以使用命令行参数进行直接配置,也可以直接通过配置文件配置一次测试的内容。
更详细对fio输出说明请参考博文:Fio Output Explained
[root@docker sda]# fio -ioengine=libaio -bs=4k -direct=1 -thread -rw=read -filename=/dev/sda -name="BS 4KB read test" -iodepth=16 -runtime=60
BS 4KB read test: (g=0): rw=read, bs=(R) 4096B-4096B, (W) 4096B-4096B, (T) 4096B-4096B, ioengine=libaio, iodepth=16
fio-3.7
Starting 1 thread
Jobs: 1 (f=1): [R(1)][100.0%][r=89.3MiB/s,w=0KiB/s][r=22.9k,w=0 IOPS][eta 00m:00s]
BS 4KB read test: (groupid=0, jobs=1): err= 0: pid=18557: Thu Apr 11 13:08:11 2019
read: IOPS=22.7k, BW=88.5MiB/s (92.8MB/s)(5313MiB/60001msec)
slat (nsec): min=901, max=168330, avg=6932.34, stdev=1348.82 //提交延迟,提交该IO请求到kernel所花的时间(不包括kernel处理的时间)
clat (usec): min=90, max=63760, avg=698.08, stdev=240.83 //完成延迟, 提交该IO请求到kernel后,处理所花的时间 (stdev:标准差)
lat (usec): min=97, max=63762, avg=705.17, stdev=240.81 //响应时间
clat percentiles (usec): //clat (提交延时)的排名分布
| 1.00th=[ 619], 5.00th=[ 627], 10.00th=[ 627], 20.00th=[ 635],
| 30.00th=[ 635], 40.00th=[ 685], 50.00th=[ 717], 60.00th=[ 725],
| 70.00th=[ 725], 80.00th=[ 725], 90.00th=[ 734], 95.00th=[ 816],
| 99.00th=[ 1004], 99.50th=[ 1020], 99.90th=[ 1057], 99.95th=[ 1057],
| 99.99th=[ 1860]
bw ( KiB/s): min=62144, max=91552, per=100.00%, avg=90669.02, stdev=3533.77, samples=120
iops : min=15536, max=22888, avg=22667.27, stdev=883.44, samples=120
lat (usec) : 100=0.01%, 250=0.01%, 500=0.01%, 750=93.85%, 1000=5.14%
lat (msec) : 2=0.99%, 4=0.01%, 10=0.01%, 50=0.01%, 100=0.01%
cpu : usr=5.35%, sys=23.17%, ctx=1359692, majf=0, minf=17
IO depths : 1=0.1%, 2=0.1%, 4=0.1%, 8=0.1%, 16=100.0%, 32=0.0%, >=64=0.0% //IO depths=io队列
submit : 0=0.0%, 4=100.0%, 8=0.0%, 16=0.0%, 32=0.0%, 64=0.0%, >=64=0.0% //单个IO提交要提交的IO数
complete : 0=0.0%, 4=100.0%, 8=0.0%, 16=0.1%, 32=0.0%, 64=0.0%, >=64=0.0% //Like the above submit number, but for completions instead.
issued rwts: total=1360097,0,0,0 short=0,0,0,0 dropped=0,0,0,0 //The number of read/write requests issued, and how many of them were short.
latency : target=0, window=0, percentile=100.00%, depth=16 //IO完延迟的分布
Run status group 0 (all jobs):
READ: bw=88.5MiB/s (92.8MB/s), 88.5MiB/s-88.5MiB/s (92.8MB/s-92.8MB/s), io=5313MiB (5571MB), run=60001-60001msec
Disk stats (read/write):
sda: ios=1357472/0, merge=70/0, ticks=949141/0, in_queue=948776, util=99.88%(磁盘利用率)
I/O 的重放('录'下实际工况的IO,用fio'重放')
fio 支持 I/O 的重放。借助 blktrace,再配合上 fio,就可以实现对应用程序 I/O 模式的“重现”。先用 blktrace ,记录磁盘设备的 I/O 访问情况;然后使用 fio ,重放 blktrace 的记录。
比如你可以运行下面的命令来操作:
# 使用blktrace跟踪磁盘I/O,注意指定应用程序正在操作的磁盘
$ blktrace /dev/sdb
# 查看blktrace记录的结果
# ls
sdb.blktrace.0 sdb.blktrace.1
# 将结果转化为二进制文件
$ blkparse sdb -d sdb.bin
# 使用fio重放日志
$ fio --name=replay --filename=/dev/sdb --direct=1 --read_iolog=sdb.bin
这样,我们就通过 blktrace+fio 的组合使用,得到了应用程序 I/O 模式的基准测试报告。
详情见:https://blog.csdn.net/neo949332116/article/details/105399841
fio工作参数可以写入配置文件
用法:
1、将fio参数写入某个文件如:mytest.conf
2、执行命令 fio后面跟着配置文件的路径:fio mytest.conf
mytest.conf 配置表示:执行10个测试(job),这10个配置的公共参数是[global]部分,不同的参数在各自job的配置下面[1]......[10]
[global]

#默认读取 /etc/ceph/ceph.conf 文件。确保 fio 运行的服务器有ceph集群的/etc/ceph/文件夹,如果没有scp 拷贝到fio 服务器上
ioengine=rbd
iodepth=64
direct=1                  # 排除OS的IO缓存机制的影响
thread=1
numjobs=1
bs=8K
runtime=1200
time_based
rw=randread
pool=.diskpool.rbd
size=50G                # 每个fio进程/线程的最大读写
group_reporting         # 多个job合并出报告

[1]
rbdname=l0
[2]
rbdname=l1
[3]
rbdname=l2
[4]
rbdname=l3
[5]
rbdname=l4
[6]
rbdname=l5
[7]
rbdname=l6
[8]
rbdname=l7
[9]
rbdname=l8
[10]
rbdname=l9
示例:
fio测试ceph | http://xiaqunfeng.cc/2017/07/12/fio-test-ceph/
测试librbd
1、创建一个image
rbd -p rbd create --size 2048 fio_test
2、撰写 job file:rbd.fio
######################################################################
# Example test for the RBD engine.
#
# Runs a 4k random write test agains a RBD via librbd
#
# NOTE: Make sure you have either a RBD named 'fio_test' or change
#       the rbdname parameter.
######################################################################
[global]
#logging
#write_iops_log=write_iops_log
#write_bw_log=write_bw_log
#write_lat_log=write_lat_log
ioengine=rbd
clientname=admin
pool=rbd
rbdname=fio_test
invalidate=0    # mandatory
rw=randwrite
bs=4k

[rbd_iodepth32]
iodepth=32
以上 job file 将执行整个RBD大小的100%随机写入测试(将通过librbd确定),Ceph用户 admin 使用Ceph 默认 pool rbd和刚刚创建的空的 RBD fio_test,写的 blocksize 为 4k 和 iodepth 为32 。 引擎正在使用异步IO。
当前实施限制:
- invalidate = 0 现在是强制需要的,engine 现在没有这个会返回失败。
- 测试完成后
rbd引擎不会被清除。完成测试运行后,给定的RBD将被填充。(我们现在使用它进行预填充测试,并在需要时重新创建RBD。)
部分参考:http://telekomcloud.github.io/ceph/2014/02/26/ceph-performance-analysis_fio_rbd.html
3、测试
fio rbd.fio
fio的iodepth参数说明
涉及到 NCQ(Native Command Queueing,本地命令队列)技术的知识,一些存储磁盘的IO口的协议支持NCQ ,如果NCQ最大深度为 32,则使用 fio 进行性能测试时,其 iodepth不得超过 32;
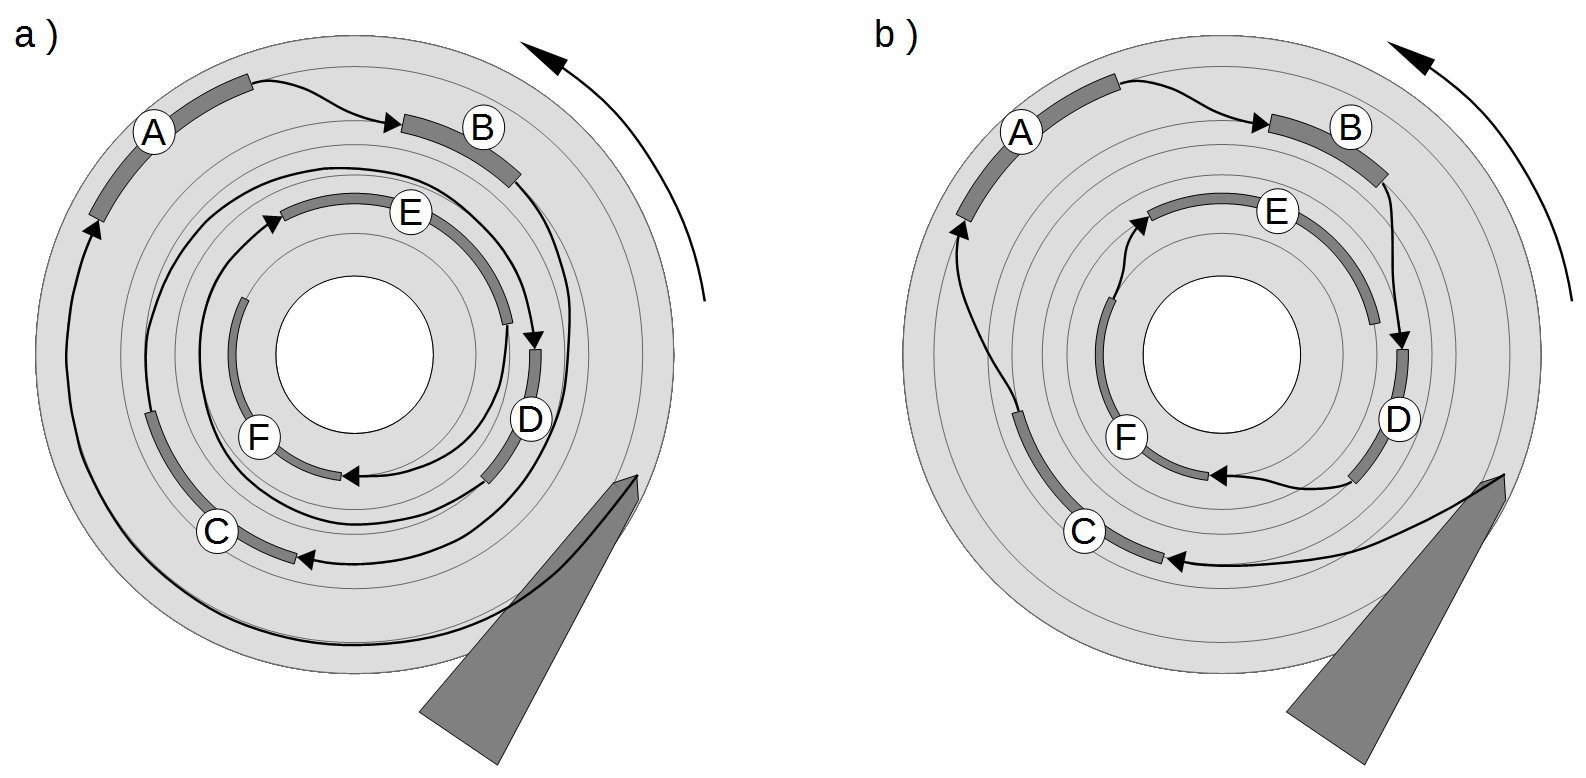
随着块设备的发展,特别是SSD盘的出现,设备的并行度越来越高。利用好这些设备,有个诀窍就是提高设备的iodepth, 一把喂给设备更多的IO请求,让电梯算法和设备有机会来安排合并以及内部并行处理,提高总体效率。
在异步模式下,CPU不能一直无限的发命令到SSD。比如SSD执行读写如果发生了卡顿,那有可能系统会一直不停的发命令,几千个,甚至几万个,这样一方面SSD扛不住,另一方面这么多命令会很占内存,系统也要挂掉了。这样,就带来一个参数叫做队列深度。
图片:https://developer.aliyun.com/article/96579
应用使用IO通常有二种方式:同步和异步。 同步的IO一次只能发出一个IO请求,等待内核完成才返回,这样对于单个线程iodepth总是小于1,但是可以透过多个线程并发执行来解决,通常我们会用16-32根线程同时工作把iodepth塞满。 异步的话就是用类似libaio这样的linux native aio一次提交一批,然后等待一批的完成,减少交互的次数,会更有效率。
io队列深度通常对不同的设备很敏感,那么如何用fio来探测出合理的值呢?
中文翻译(原文在后面)
iodepth=int
针对文件 保持 运行的 I/O 单元数。请注意,将 iodepth 增加到 1 以上不会影响同步 ioengine
(使用 verify_async 时的小幅度变化除外)。即使是异步引擎我也会施加操作系统限制,导致所需的深度不达到。在 Linux 上使用 libaio 且未设置 direct=1 时可能会发生这种情况,因为缓冲 IO 在该操作系统上不是异步的。密切关注fio 输出中的 IO 深度分布,以验证达到的深度是否符合预期。默认:1.
iodepth_batch=int
一次提交的 I/O 数量。默认值:iodepth。
iodepth_batch_complete=int
这定义了一次检索多少个 IO。它默认为 1。意味着我们在检索过程中要内核检索到 1 个 IO。 IO 返回。检索将一直持续到我们达到限制为止,由 iodepth_low 设置。如果此变量设置为 0,则 fio 将始终在排队更多 IO 之前检查已完成的事件。这有助于减少 IO 延迟,代价是更多的检索系统调用。
iodepth_low=int
指示何时再次开始填充队列的低水位线。默认值:iodepth。direct=布尔
如果为真,则使用非缓冲 I/O(通常为 O_DIRECT)。默认值:假。fsync=int
在发出 fsync(2) 脏数据之前要执行多少 I/O。如果为 0,则不同步。默认值:0。
原文:
iodepth=int
Number of I/O units to keep in flight against the file. Note that increasing iodepth beyond 1 will not affect synchronous ioengines (except for small degress when verify_async is in use). Even async engines my impose OS restrictions causing the desired depth not to be achieved. This may happen on Linux when using libaio and not setting direct=1, since buffered IO is not async on that OS. Keep an eye on the IO depth distribution in the fio output to verify that the achieved depth is as expected. Default:1.iodepth_batch=int
Number of I/Os to submit at once. Default: iodepth.iodepth_batch_complete=int
This defines how many pieces of IO to retrieve at once. It defaults to 1 which
means that we’ll ask for a minimum of 1 IO in the retrieval process from the kernel. The IO retrieval will go on until we hit the limit
set by iodepth_low. If this variable is set to 0, then fio will always check for completed events before queuing more IO. This helps
reduce IO latency, at the cost of more retrieval system calls.iodepth_low=int
Low watermark indicating when to start filling the queue again. Default: iodepth.direct=bool
If true, use non-buffered I/O (usually O_DIRECT). Default: false.fsync=int
How many I/Os to perform before issuing an fsync(2) of dirty data. If 0, don’t sync. Default: 0.
这几个参数在libaio的引擎下的作用,文档写的挺明白,但容我再罗嗦下IO请求的流程:
libaio引擎会用这个iodepth值来调用io_setup准备个可以一次提交iodepth个IO的上下文,同时申请个io请求队列用于保持IO。 在压测进行的时候,系统会生成特定的IO请求,往io请求队列里面扔,当队列里面的IO个数达到iodepth_batch值的时候,就调用io_submit批次提交请求,然后开始调用io_getevents开始收割已经完成的IO。 每次收割多少呢?由于收割的时候,超时时间设置为0,所以有多少已完成就算多少,最多可以收割iodepth_batch_complete值个。随着收割,IO队列里面的IO数就少了,那么需要补充新的IO。 什么时候补充呢?当IO数目降到iodepth_low值的时候,就重新填充,保证OS可以看到至少iodepth_low数目的io在电梯口排队着。
注意:这些参数在文档里面描述的有点小问题,比如说默认值什么的是不太对的,所以我的建议是这些参数要去显示的写。
如何确认fio安装我们的配置在工作呢? fio提供了诊断办法 --debug=io ,我们来演示下:
# cat nvdisk-test
[global]
bs=512
ioengine=libaio
userspace_reap
rw=randrw
rwmixwrite=20
time_based
runtime=180
direct=1
group_reporting
randrepeat=0
norandommap
ramp_time=6
iodepth=16
iodepth_batch=8
iodepth_low=8
iodepth_batch_complete=8
exitall
[test]
filename=/dev/nvdisk0
numjobs=1
fio任务配置里面有几个点需要非常注意:
1. libaio工作的时候需要文件direct方式打开。
2. 块大小必须是扇区(512字节)的倍数。
3. userspace_reap提高异步IO收割的速度。
4. ramp_time的作用是减少日志对高速IO的影响。
5. 只要开了direct,fsync就不会发生。
# fio nvdisk-test --debug=io
fio: set debug option io
io       22441 load ioengine libaio
io       22441 load ioengine libaio
test: (g=0): rw=randrw, bs=512-512/512-512, ioengine=libaio, iodepth=16
fio 2.0.5
Starting 1 process
io       22444 invalidate cache /dev/nvdisk0: 0/8589926400
io       22444 fill_io_u: io_u 0x6d3210: off=3694285312/len=512/ddir=0//dev/nvdisk0
io       22444 prep: io_u 0x6d3210: off=3694285312/len=512/ddir=0//dev/nvdisk0
io       22444 ->prep(0x6d3210)=0
io       22444 queue: io_u 0x6d3210: off=3694285312/len=512/ddir=0//dev/nvdisk0
io       22444 fill_io_u: io_u 0x6d2f80: off=4595993600/len=512/ddir=0//dev/nvdisk0
io       22444 prep: io_u 0x6d2f80: off=4595993600/len=512/ddir=0//dev/nvdisk0
io       22444 ->prep(0x6d2f80)=0
io       22444 queue: io_u 0x6d2f80: off=4595993600/len=512/ddir=0//dev/nvdisk0
io       22444 fill_io_u: io_u 0x6d2cb0: off=3825244160/len=512/ddir=0//dev/nvdisk0
io       22444 prep: io_u 0x6d2cb0: off=3825244160/len=512/ddir=0//dev/nvdisk0
io       22444 ->prep(0x6d2cb0)=0
io       22444 queue: io_u 0x6d2cb0: off=3825244160/len=512/ddir=0//dev/nvdisk0
io       22444 fill_io_u: io_u 0x6d29a0: off=6994864640/len=512/ddir=0//dev/nvdisk0
io       22444 prep: io_u 0x6d29a0: off=6994864640/len=512/ddir=0//dev/nvdisk0
io       22444 ->prep(0x6d29a0)=0
io       22444 queue: io_u 0x6d29a0: off=6994864640/len=512/ddir=0//dev/nvdisk0
io       22444 fill_io_u: io_u 0x6d2710: off=2572593664/len=512/ddir=0//dev/nvdisk0
io       22444 prep: io_u 0x6d2710: off=2572593664/len=512/ddir=0//dev/nvdisk0
io       22444 ->prep(0x6d2710)=0
io       22444 queue: io_u 0x6d2710: off=2572593664/len=512/ddir=0//dev/nvdisk0
io       22444 fill_io_u: io_u 0x6d2400: off=3267822080/len=512/ddir=0//dev/nvdisk0
io       22444 prep: io_u 0x6d2400: off=3267822080/len=512/ddir=0//dev/nvdisk0
io       22444 ->prep(0x6d2400)=0
io       22444 queue: io_u 0x6d2400: off=3267822080/len=512/ddir=0//dev/nvdisk0
io       22444 fill_io_u: io_u 0x6d2130: off=7099489280/len=512/ddir=0//dev/nvdisk0
io       22444 prep: io_u 0x6d2130: off=7099489280/len=512/ddir=0//dev/nvdisk0
io       22444 ->prep(0x6d2130)=0
io       22444 queue: io_u 0x6d2130: off=7099489280/len=512/ddir=0//dev/nvdisk0
io       22444 fill_io_u: io_u 0x6d1ea0: off=7682447872/len=512/ddir=0//dev/nvdisk0
io       22444 prep: io_u 0x6d1ea0: off=7682447872/len=512/ddir=0//dev/nvdisk0
io       22444 ->prep(0x6d1ea0)=0
io       22444 queue: io_u 0x6d1ea0: off=7682447872/len=512/ddir=0//dev/nvdisk0
io       22444 calling ->commit(), depth 8
io       22444 fill_io_u: io_u 0x6d1b90: off=5983331840/len=512/ddir=0//dev/nvdisk0
io       22444 prep: io_u 0x6d1b90: off=5983331840/len=512/ddir=0//dev/nvdisk0
io       22444 ->prep(0x6d1b90)=0
io       22444 queue: io_u 0x6d1b90: off=5983331840/len=512/ddir=0//dev/nvdisk0
io       22444 fill_io_u: io_u 0x6cdfa0: off=6449852928/len=512/ddir=0//dev/nvdisk0
...
我们可以看到详细的IO工作过程,这个方法不需要对OS非常的熟悉,比较实用。
还有个方法就是透过strace来跟踪系统调用的情况, 更直观点。
# pstree -p
init(1)─┬─agent_eagleye(22296)
        ├─screen(13490)─┬─bash(18324)─┬─emacs(19429)
        │               │             ├─emacs(20365)
        │               │             ├─emacs(21268)
        │               │             ├─fio(22452)─┬─fio(22454)
        │               │             │            └─{fio}(22453)
        │               │             └─man(20385)───sh(20386)───sh(20387)───less(20391)
        ├─sshd(1834)───sshd(13115)───bash(13117)───screen(13662)
        └─udevd(705)─┬─udevd(1438)
                     └─udevd(1745
# strace -p 22454
...
io_submit(140534061244416, 8, {{(nil), 0, 1, 0, 3}, {(nil), 0, 0, 0, 3}, {(nil), 0, 0, 0, 3}, {(nil), 0, 0, 0, 3}, {(nil), 0, 0, 0, 3}, {(nil), 0, 1, 0, 3}, {(nil), 0, 1, 0, 3}, {(nil), 0, 0, 0, 3}}) = 8
io_getevents(140534061244416, 8, 8, {{(nil), 0x6d3210, 512, 0}, {(nil), 0x6d2f80, 512, 0}, {(nil), 0x6d2cb0, 512, 0}, {(nil), 0x6d29a0, 512, 0}, {(nil), 0x6d2710, 512, 0}, {(nil), 0x6d2400, 512, 0}, {(nil), 0x6d2130, 512, 0}, {(nil), 0x6d1ea0, 512, 0}}, NULL) = 8
...
最后有效的一招就是用iostat -dx 1来确认你的iodepth是符合设备特性的。

(由于我用的是nvram卡,这个卡的设备驱动没有队列,iostat看不到队列深度,就用了其他的设备的图代替,表明可以用看iostat看IO队列深度,谢谢网友Uranus指出)
通过这些方法确认你的配置是对的,之后分析出来的数据才会有意义。
IO状态监控:
进行磁盘测试的时候,我们可以使用iostat 等监控工具,查看所有磁盘当前的读写状态(fedora 系统上 sysstat-11.7.3-2.fc29.x86_64 收录了此工具)。
监控磁盘IO命令:iostat -mx 1
https://blog.csdn.net/bandaoyu/article/details/120190836
Iostat介绍
iostat主要用于监控系统设备的IO负载情况,iostat首次运行时显示自系统启动开始的各项统计信息,之后运行iostat将显示自上次运行该命令以后的统计信息。用户可以通过指定统计的次数和时间来获得所需的统计信息。
Iostat的相关说明和用法,看:
磁盘、CPU统计iostat工具_https://blog.csdn.net/bandaoyu/article/details/121126446
参考:
linux 磁盘IO测试工具:https://www.cnblogs.com/xuyaowen/archive/2019/04/11/fio-usage.html
Linux IO实时监控iostat命令详解 https://www.cnblogs.com/ggjucheng/archive/2013/01/13/2858810.html
Ceph性能测试工具和方法。https://www.cnblogs.com/gaohong/p/5818086.html
Ceph测试系列(二):ceph性能测试fio工具 https://blog.csdn.net/don_chiang709/article/details/92773991
其他相关工具和内容
与FIO相似的工具
vdbench 、mdtest、dd
【ceph】vdbench的使用教程 https://blog.csdn.net/bandaoyu/article/details/121568182
fio测试脚本
#!/bin/bash

set -e

ioengine="libaio"
iodepth=128
direct=1
fsync=1
runtime=600
size="10G"

mntdir="/mnt/fio-data/"
mkdir -p /mnt/fio-data
mount /dev/vdb /mnt/fio-data || true

for m in seq rand
do
	prefix=""
	if [ "$m" == "seq" ] ; then
		bs="1024K"
	else
		bs="4K"
		prefix="rand"
	fi

	for op in read write
	do
		cat <<EOF >$mntdir/fio-$m-$op.fio
[global]
fsync=$fsync
name=fio-$m-$op
filename=fio-$m-$op
rw=$prefix$op
bs=$bs
direct=$direct
numjobs=1
time_based=1
runtime=$runtime

[file1]
size=$size
ioengine=$ioengine
iodepth=$iodepth
EOF
	done
done

docker rm -f $(docker ps -a -q) >/dev/null 2>&1|| true

echo "test case: $c"

outdir=`pwd`/result-`date "+%Y%m%d%H%M"`
mkdir -p $outdir

for p in `ls -1 $mntdir/*.fio`
do
	f=`basename $p`
	echo 3 > /proc/sys/vm/drop_caches

	cmd="docker run --name=$f -v $mntdir:/tmp/fio-data -e JOBFILES=/tmp/fio-data/$f \
		clusterhq/fiotools-aio bash /opt/run.sh \
		| tee -a $outdir/$f.log"
	echo $cmd
	eval $cmd

	sleep 1
done
提取iops和bw
#!/usr/bin/python2.7

import os
import re
from pathlib import Path

def get_perf(file, type, perf):
    m = re.compile('\s*{}\s*: .* {}=(\d+)'.format(type, perf))
    with open(file) as f:
        for line in f.readlines():
            g = m.search(line)
            if g is not None and len(g.groups()) == 1:
                return g.groups()[0]
    raise Exception("{} {} not found".format(type, perf))


def parse(dir, perf):
    data = []

    perf_type = 'rand' if perf == 'iops' else 'seq'

    dirs = Path(dir).glob('result-*/')
    for d in dirs:
        f = os.path.join(d.name, 'fio-%s-read.fio.log' % perf_type)
        read = get_perf(f, "read", perf)

        f = os.path.join(d.name, 'fio-%s-write.fio.log' % perf_type)
        write = get_perf(f, "write", perf)

        data.append((read, write))

    return data

if __name__ == '__main__':
    cwd = os.path.dirname(os.path.realpath(__file__))

    data = parse(cwd, "iops")
    with open("iops.txt", "w") as f:
        i = 1
        for l in data:
            f.write('{} {} {}\n'.format(i, l[0], l[1]))
            i = i + 1

    data = parse(cwd, "bw")
    with open("bw.txt", "w") as f:
        i = 1
        for l in data:
            f.write('{} {} {}\n'.format(i, l[0], l[1]))
            i = i + 1
gunplot画图
- iops
#!/bin/bash

data=iops.txt
pic=iops.png

/usr/local/bin/gnuplot << EOF

set autoscale   # scale axes automatically
set xtic 1      # set xtics automatically
set ytic 1000       # set ytics automatically
set title "IOPS over Time"
set xlabel "samples over time"
set ylabel "iops"
set grid
set term png medium
set term png size 953, 620
set key box top left
set output "$pic"
plot "$data" using 1:2 title "read" with linespoints, \
	"$data" using 1:3 title "write" with linespoints

quit
EOF
IO优化思路和IO栈图
I/O 性能优化
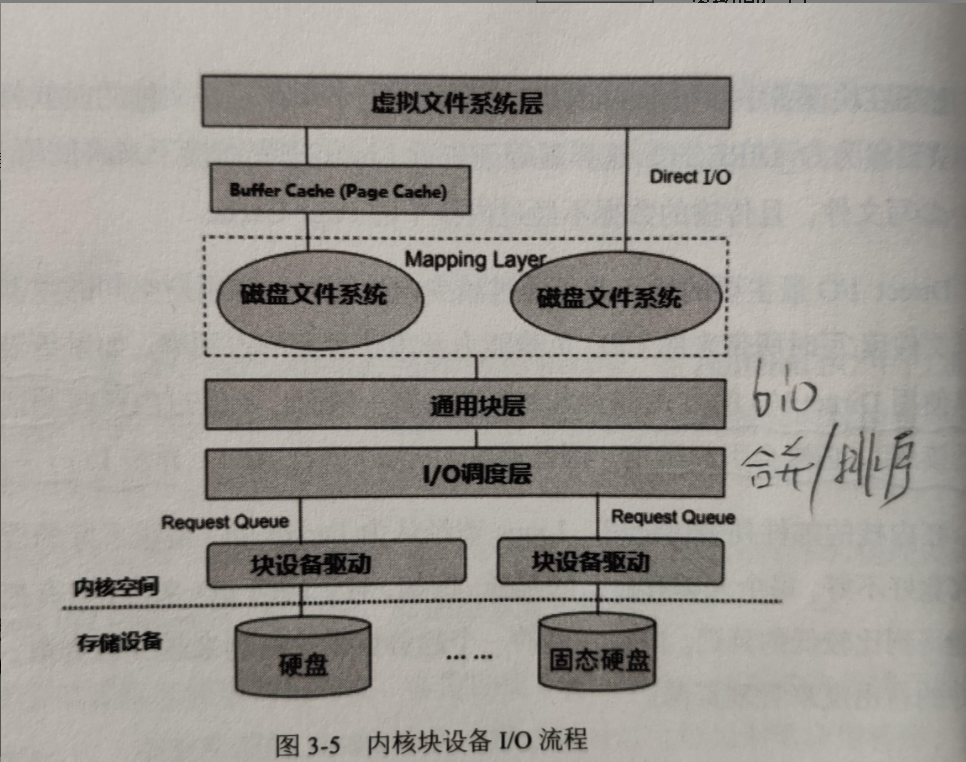
得到 I/O 基准测试报告后,再用上我们上一节总结的性能分析套路,找出 I/O 的性能瓶颈并优化,就是水到渠成的事情了。当然, 想要优化 I/O 性能,肯定离不开 Linux 系统的 I/O 栈图的思路辅助。你可以结合下面的 I/O 栈图再回顾一下。
IO栈图:分享一篇很棒的Linux IO栈讲解 https://www.cnblogs.com/cbam/p/11816443.html
应用程序处于整个 I/O 栈的最上端,它可以通过系统调用,来调整 I/O 模式(如顺序还是随机、同步还是异步), 同时,它也是 I/O 数据的最终来源。在我看来,可以有这么几种方式来优化应用程序的 I/O 性能。
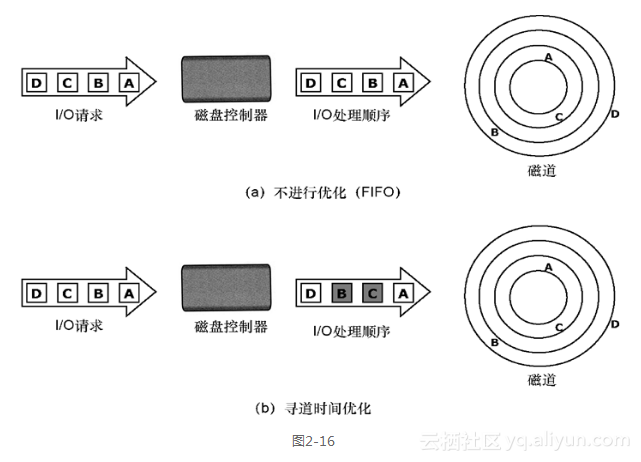
第一,可以用追加写代替随机写,减少寻址开销,加快 I/O 写的速度。
第二,可以借助缓存 I/O ,充分利用系统缓存,降低实际 I/O 的次数。
第三,可以在应用程序内部构建自己的缓存,或者用 Redis 这类外部缓存系统。这样,一方面,能在应用程序内部,控制缓存的数据和生命周期;另一方面,也能降低其他应用程序使用缓存对自身的影响。
原文链接:https://blog.csdn.net/neo949332116/article/details/105399841
https://www.pianshen.com/article/8877886409/
Fio 输出内容的解释
以loop块设备的fio输出结果为例,图示各个部分的含义:
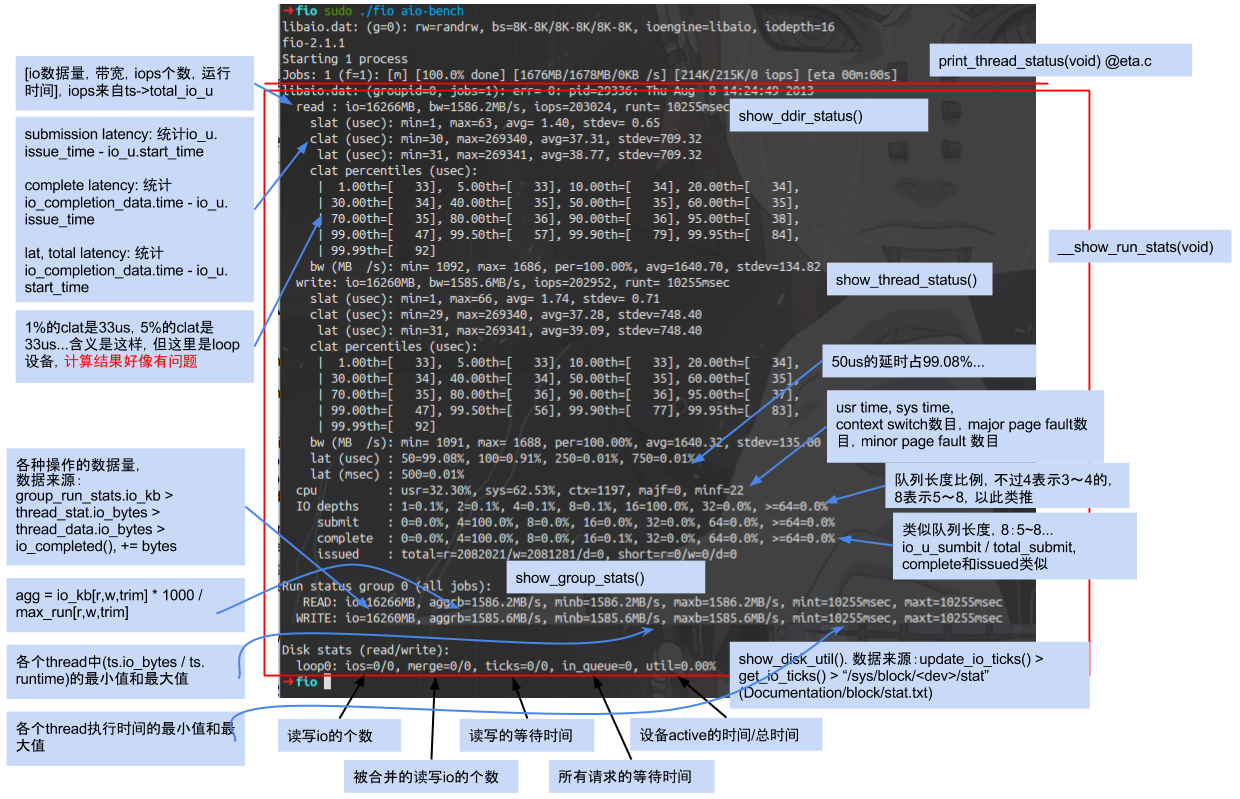
摘自:fio简介
其他
Fio 输出内容的解释 https://blog.csdn.net/feilianbb/article/details/50497845
翻译原文来源
Fio Output Explained https://tobert.github.io/post/2014-04-17-fio-output-explained.html
read : io=10240MB, bw=63317KB/s, iops=15829, runt=165607msecfio做了10GB的IO,速率63.317MB/s,总IOPS 15829 (默认4k block size),运行了2分钟45秒。
slat,或称为submission latency。代表“盘需要多久将IO提交到kernel做处理?”。
slat (usec): min=3, max=335, avg= 9.73, stdev= 5.76clat,completion latency。命令提交到kernel到IO做完之间的时间,不包括submission latency。在老版本的fio中,这是估计应用级延迟的最好指标。
clat (usec): min=1, max=18600, avg=51.29, stdev=16.79lat (usec): min=44, max=18627, avg=61.33, stdev=17.91
'lat'是一个新的指标,似乎这个值是从IO结构体创建时刻开始,直到紧接着clat完成,这个算法最好地表现出了应用程序的行为。
clat percentiles (usec):

| 1.00th=[ 42], 5.00th=[ 45], 10.00th=[ 45], 20.00th=[ 46],

| 30.00th=[ 47], 40.00th=[ 47], 50.00th=[ 49], 60.00th=[ 51],

| 70.00th=[ 53], 80.00th=[ 56], 90.00th=[ 60], 95.00th=[ 67],

| 99.00th=[ 78], 99.50th=[ 81], 99.90th=[ 94], 99.95th=[ 101],

| 99.99th=[ 112]
Completion latency百分数的解释一目了然,可能是输出信息中最有用的部分。我看了代码,这不是slat+clat,而是用了单独的结构体记录。
这个列表可以在config文件中配置。在精简输出模式下有20个这样的格式,%f=%d; %f=%d;... 解析这样的输出格式会很有趣。
clat percentiles (usec):
     |  1.00th=[ 3952],  5.00th=[ 5792], 10.00th=[ 7200], 20.00th=[ 8896],
     | 30.00th=[10304], 40.00th=[11456], 50.00th=[12608], 60.00th=[13760],
     | 70.00th=[15168], 80.00th=[16768], 90.00th=[18816], 95.00th=[20608],
     | 99.00th=[23424], 99.50th=[24192], 99.90th=[26752], 99.95th=[28032],
     | 99.99th=[30080]

    bw (KB  /s): min=52536, max=75504, per=67.14%, avg=63316.81, stdev=4057.09
带宽(bandwidth)的意思显而易见,而per=part就不是很好理解。文档上说这个值是指在单个盘上跑多个负载,可以用来看每个进程消耗了多少IO。对于我这样把fio跑在多个盘的情况,这个值意义不大。但由于SSD和机械硬盘混合使用,这个值挺有趣。
下面是另一个SAS硬盘,占测试的所有4个盘总IO的0.36%。
    bw (KB  /s): min=   71, max=  251, per=0.36%, avg=154.84, stdev=18.29

    lat (usec) :   2= 0.01%,   4=0.01%,  10=0.01%,   20=0.01%, 50=51.41%
    lat (usec) : 100=48.53%, 250=0.06%, 500=0.01%, 1000=0.01%
    lat (msec) :   2= 0.01%,   4=0.01%,  10=0.01%,   20=0.01%
latency分布,第三行使用了毫秒(ms),使得文本宽度可控。把第三行读成2000, 4000, 10000, 20000微秒(us)就更清晰了。说明了51.41%的request延迟小于50微秒,48.53%的延迟小于100微秒(但是大于50微秒),以此类推。
cpu : usr=5.32%, sys=21.95%, ctx=2829095, majf=0, minf=21这是用户/系统CPU占用率,进程上下文切换(context switch)次数,主要和次要(major and minor)页面错误数量(page faults)。由于测试是配置成使用直接IO,page faults数量应该极少。
IO depths : 1=100.0%, 2=0.0%, 4=0.0%, 8=0.0%, 16=0.0%, 32=0.0%, >=64=0.0%Fio有一个iodepth设置,用来控制同一时刻发送给OS多少个IO。这完全是纯应用层面的行为,和盘的IO queue不是一回事。这里iodepth设成1,所以IO depth在全部时间都是1。
     submit    : 0=0.0%, 4=100.0%, 8=0.0%, 16=0.0%, 32=0.0%, 64=0.0%, >=64=0.0%
     complete  : 0=0.0%, 4=100.0%, 8=0.0%, 16=0.0%, 32=0.0%, 64=0.0%, >=64=0.0%
通常来说,只有iodepth大于1才需要关注这一部分数据。,submit和complete代表同一时间段内fio发送和已完成的IO数量。对于产生这个输出的垃圾回收测试用例来说,iodepth是默认值1,所以100%的IO在同一时刻发送1次,放在1-4栏位里。
issued : total=r=2621440/w=0/d=0, short=r=0/w=0/d=0发送的IO数量。这里出现了奇怪的现象,因为这是50/50的读写负载,照道理应该有相同数量的write。我猜测把unified_rw_reporting打开是的fio把所有的IO都认为是read。
如果你在直接IO测试是看到了IO值很低,那么可能是出问题了。我在Linux kernel中找到参考说这种现象发生在文件末尾EOL或可能是设备的尾端。
latency : target=0, window=0, percentile=100.00%, depth=1Fio可以配置一个延迟目标值,这个值可以调节吞吐量直到达到预设的延迟目标。我还没有太多深入了解这部分。在基于时间或和容量的测试中,这行通常看起来一样。四个值分别代表预设的latency_target, latency_window, latency_percentile和iodepth。
Run status group 0 (all jobs):Fio支持把不同的测试聚合。例如,我可以用一个配置文件混合包含SSD和HDD,但是设置分组(group)把IO单独汇总。我现在还没涉及这个功能,但未来会用到。
MIXED: io=12497MB, aggrb=42653KB/s, minb=277KB/s, maxb=41711KB/s, mint=300000msec, maxt=300012msec最后,汇总输出吞吐量和时间。
io=表示总共完成的IO数量。在基于时间的测试中这是一个变量,在基于容量的测试中,这个值能匹配size参数。
aggrb是所有进程/设备的汇总带宽。
minb/maxb表示测量到的最小/最大带宽。
mint/maxt表示测试的最短和最长耗时。和io=参数类似,时间值对于基于时间的测试应该能匹配runtime参数,对于基于容量的测试是一个变量。
由于我设置了unified_rw_reporting参数运行测试,所以只看到MIXED一行。如果禁用这个参数,对于读和写会有单独的行。
够简单吧?我未来的几周会花更多的时间研究fio,我会发布更多关于配置,输出和图表代码的例子。
工作实例
./fio --ioengine=rbd --iodepth=4 --numjobs=8 --pool=.rbdpool.rbd --rbdname=lun0 --name=write5 --rw=randwrite --bs=1M --size=10G --group_reporting --direct=1

./fio --ioengine=rbd --iodepth=4 --numjobs=8 --pool=.rbdpool.rbd --rbdname=lun0 --name=write5 --rw=randwrite --bs=1M --size=10G --group_reporting --direct=1

./fio --ioengine=rbd --iodepth=4 --numjobs=8 --pool=.rbdpool.rbd --rbdname=lun0 --name=write5 --rw=randwrite --bs=1M --size=10G --group_reporting --direct=1
查看fio支持的引擎
$./fio --enghelp相关命令
fio2gnuplot.py
fio_generate_plots
genfio
更多关于磁盘顺序io 部分,可以参考 dd 工具的使用;dd 工具使用; https://www.cnblogs.com/xuyaowen/p/dd.html
FIO 图形界面工具:http://blog.yufeng.info/archives/2721
参考链接:
磁盘测试工具FIO工具安装和使用方法 https://www.cnblogs.com/bugutian/p/6653083.html
fio 最佳磁盘性能测试工具_Linux教程_Linux公社-Linux系统门户网站
Linux 磁盘IO性能测试工具:FIO_Nothing is impossible-CSDN博客_fio测试磁盘性能 (有很好的fio 输出日志注释,解释了每行输出内容的含义,建议阅读。)
IO测试工具之fio详解 https://www.cnblogs.com/raykuan/p/6914748.html
Linux使用dd命令测试硬盘读写速度 https://blog.csdn.net/feng4656/article/details/11054595
Fio Output Explained https://tobert.github.io/post/2014-04-17-fio-output-explained.html
https://github.com/axboe/fio/blob/master/HOWTO
保持更新,转载请注明出处。
附录
附录1 fio iodepth的意义
常见的 SSD 主要分为 SATA和 PCIe 接口,其接口协议对应着 AHCI、NVMe 协议。相比于最原始的 ATA 协议,AHCI 有 2 个特点,第 1 个支持热插拔,第 2 个支持 NCQ(Native Command Queueing,本地命令队列)技术,NCQ 最大深度为 32,则使用 fio 进行性能测试时,其 iodepth不得超过 32;
原文链接:https://blog.csdn.net/bandaoyu/article/details/121072279


