
ELK7.13+Kafa+Filebeat集群安装部署
2021年8月13号部署
一. 摘要
ELK+Kafka+Filebeat是由Elasticsearch,Logstash,Kibana,Kafka以及Filebeat几大组件构成的一个基于web页面的日志分析工具。
日志分析是运维和开发解决系统故障,发现问题的主要手段。日志包含多种类型,包括程序日志,系统日志以及安全日志等。通过对日志分析,预发故障的发生,又可以在故障发生时,寻找到蛛丝马迹,快速定位故障点。及时解决。
二、集群架构及介绍

上面架构图分为五层,详细解释如下:
1. 第一层:数据采集
最左边的是filebeat做日志采集,同时把采集的日志分别发送给两个Kafka。
2. 第二层:数据缓存
kafka broker集群收集日志数据进行缓存。
3. 第三层:数据处理转发
logstash服务把接受到的日志,经过格式处理推送到ES DataNode。
4. 第四层:数据存储和搜索
ES DataNode 会把收到的数据,写磁盘,建索引库。
5. 第五层:数据展示
ES Master + Kibana 主要 协调 ES集群,处理数据检索请求,数据展示。
三. 组件介绍
1. ElasticSearch
是一个基于Lucene的搜索服务器。提供搜集、分析、存储数据三大功能。它提供了一个分布式多用户能力的全文搜索引擎,基于RESTful web接口。Elasticsearch是用java开发的,并作为Apache许可条款下的开放源码发布,
是当前流行的企业级搜索引擎。设计用于云计算中,能够达到实时搜索,稳定,可靠,快速,安装使用方便
2. Logstash
主要是用来日志的搜索、分析、过滤日志的工具。用于管理日志和事件的工具,你可以用它去收集日志、转换日志、解析日志并将他们作为数据提供给其它模块调用,例如搜索、存储等
3. Kibana
是一个优秀的前端日志展示框架,它可以非常详细的将日志转化为各种图标,为用户提供强大的数据可视化支持,它能够搜索、展示存储在Elasticsearch中索引数据。使用它可以很方便的使用图表、表格、地图展示和分析数据
4. Kafka
数据缓冲队列。作为消息队列解耦了处理过程,同时提高了可扩展性。具有峰值处理能力,使用消息队列能够使关键组件顶住突发的访问压力,而不会因为突发的超负荷的请求而完全崩溃
- 发布和订阅记录流,类似于消息队列或企业消息传递系统
- 以容错持久的方式存储记录流
- 处理记录发生的流
5. filebeat
隶属于Beats,轻量级数据收集引擎。基于原先Logstash-forwarder的源码改造出来。换句话说:Filebeat就是新版的Logstash-forwarder,也会是ELK Stack在Agent的第一选择,目前Beats包含四种工具:
- Packetbeat(搜集网络流量数据)
- Metricbeat(搜集系统、进程和文件系统级别的CPU和内存使用情况等数据)
- Filebeat(搜集文件系统)
- Winlogbeat(搜集Windows事件日志数据)
四、环境介绍
1.服务器环境信息
|
主机 |
IP |
系统版本 |
配置 |
安装的软件 |
|
server1 |
192.168.1.130 |
Centos7.9 |
2C/16G/100G |
ElasticSearch、Logstash、Kafka、Zookeeper、Kibana |
|
server2 |
192.168.1.131 |
Centos7.9 |
2C/16G/100G |
ElasticSearch、Logstash、Kafka、Zookeeper、ElastAlert |
|
server3 |
192.168.1.132 |
Centos7.9 |
2C/16G/100G |
ElasticSearch、Kafka、Zookeeper Filebeat、ElastAlert-dingding |
Zookeeper使用的是kafka自带的,ElastAlert是告警插件,下个章节会讲到(用不到可忽略);举个例子,es收录到了名为“error”的bug日志,ElastAlert检测到以后,通过钉钉(邮件)等方式发送警告,收到告警后,这样我们就可以及时的去kibana查看具体日志啦。
2.软件版本信息
elasticsearch-7.13.0

logstash-7.13.0

kibana-7.13.0

kafka-2.13-2.6.0
五、安装部署
1. ElasticSearch集群部署
1.1.系统初始化
三台服务器都得执行

#修改系统参数

echo '* soft nproc 65535

root soft nproc unlimited' > /etc/security/limits.d/20-nproc.conf


echo 'vm.max_map_count=262144' > /etc/sysctl.conf

sysctl -p


echo '* soft nofile 65535

* hard nofile 65535

* soft nproc 65535

* hard nproc 65535' > /etc/security/limits.conf


创建用户

groupadd elastic

useradd elastic -g elastic
1.2.jdk安装部署
使用ES自带的jdk11即可,不用做任何操作
1.3.elasticsearch安装
1、下载
wget https://artifacts.elastic.co/downloads/elasticsearch/elasticsearch-7.13.0-linux-x86_64.tar.gz
cd /usr/local/src

tar zxvf  elasticsearch-7.13.0-linux-x86_64.tar.gz

mv elasticsearch-7.13.0 ../elasticsearch

mkdir  /data/elasticsearch
2、修改配置
192.168.66.130
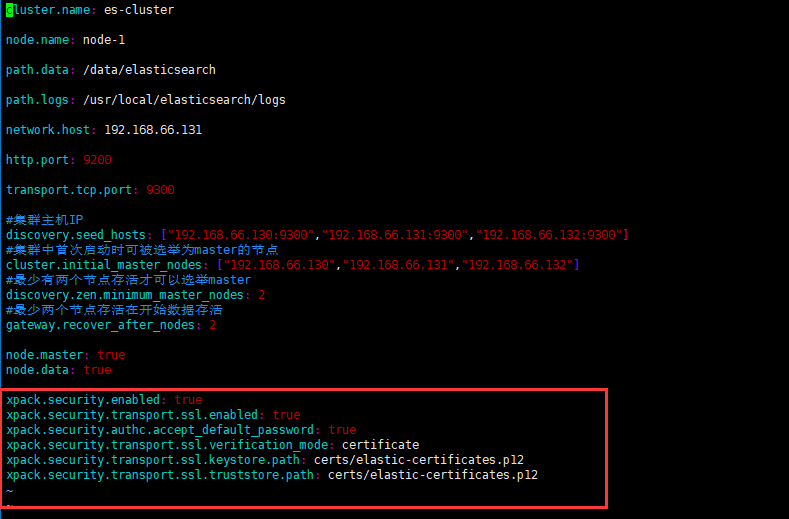
cluster.name: es-cluster

node.name: node-1

path.data: /data/elasticsearch

path.logs: /usr/local/elasticsearch/logs

network.host: 192.168.66.130

http.port: 9200

transport.tcp.port: 9300

#集群主机IP

discovery.seed_hosts: ["192.168.66.130:9300","192.168.66.131:9300","192.168.66.132:9300"]

#集群中首次启动时可被选举为master的节点

cluster.initial_master_nodes: ["192.168.66.130","192.168.66.131","192.168.66.132"]

#最少有两个节点存活才可以选举master

discovery.zen.minimum_master_nodes: 2

#最少两个节点存活在开始数据存活

gateway.recover_after_nodes: 2

node.master: true

node.data: true
#禁止操作系统交换出去,就是不使用swap,会影响es性能
bootstrap.mlockall: true
192.168.66.131
cluster.name: es-cluster

node.name: node-2

path.data: /data/elasticsearch

path.logs: /usr/local/elasticsearch/logs

network.host: 192.168.66.131

http.port: 9200

transport.tcp.port: 9300

#集群主机IP

discovery.seed_hosts: ["192.168.66.130:9300","192.168.66.131:9300","192.168.66.132:9300"]

#集群中首次启动时可被选举为master的节点

cluster.initial_master_nodes: ["192.168.66.130","192.168.66.131","192.168.66.132"]

#最少有两个节点存活才可以选举master

discovery.zen.minimum_master_nodes: 2

#最少两个节点存活在开始数据存活

gateway.recover_after_nodes: 2

node.master: true

node.data: true
#禁止操作系统交换出去,就是不使用swap,会影响es性能
bootstrap.mlockall: true
192.168.66.132
cluster.name: es-cluster

node.name: node-3

path.data: /data/elasticsearch

path.logs: /usr/local/elasticsearch/logs

network.host: 192.168.66.132

http.port: 9200

transport.tcp.port: 9300

#集群主机IP

discovery.seed_hosts: ["192.168.66.130:9300","192.168.66.131:9300","192.168.66.132:9300"]

#集群中首次启动时可被选举为master的节点

cluster.initial_master_nodes: ["192.168.66.130","192.168.66.131","192.168.66.132"]

#最少有两个节点存活才可以选举master

discovery.zen.minimum_master_nodes: 2

#最少两个节点存活在开始数据存活

gateway.recover_after_nodes: 2

node.master: true

node.data: true
#禁止操作系统交换出去,就是不使用swap,会影响es性能
bootstrap.mlockall: true
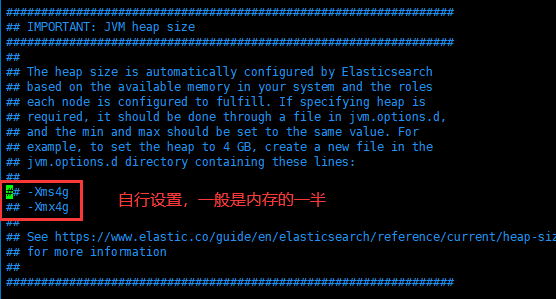
设置jvm大小

内存默认为1G,请在/usr/local/elasticsearch/config/jvm.options自行调整
1.4.启动es
# su - elastic -c "/usr/local/elasticsearch/bin/elasticsearch -d"

#查看日志,是否正常启动

# tail -f /usr/local/elasticsearch/logs/es.log
1.5.查看集群健康状态
http://192.168.66.130:9200/_cluster/health?pretty

{

  "cluster_name" : "es-cluster",

  "status" : "green",

  "timed_out" : false,

  "number_of_nodes" : 3,

  "number_of_data_nodes" : 3,

  "active_primary_shards" : 15,

  "active_shards" : 30,

  "relocating_shards" : 0,

  "initializing_shards" : 0,

  "unassigned_shards" : 0,

  "delayed_unassigned_shards" : 0,

  "number_of_pending_tasks" : 0,

  "number_of_in_flight_fetch" : 0,

  "task_max_waiting_in_queue_millis" : 0,

  "active_shards_percent_as_number" : 100.0

}

其他两台的返回一样的结果

http://192.168.66.131:9200/_cluster/health?pretty

http://192.168.66.132:9200/_cluster/health?pretty
1.6.安全认证
2019年5月21日,Elastic官方发布消息: Elastic Stack 新版本6.8.0 和7.1.0的核心安全功能现免费提供。
这意味着用户现在能够对网络流量进行加密、创建和管理用户、定义能够保护索引和集群级别访问权限的角色,并且使用 Spaces 为 Kibana提供全面保护。 免费提供的核心安全功能如下:
1)TLS 功能。 可对通信进行加密;
2)文件和原生 Realm。 可用于创建和管理用户;
3)基于角色的访问控制。 可用于控制用户对集群 API 和索引的访问权限;
通过针对 Kibana Spaces 的安全功能,还可允许在Kibana 中实现多租户。

总结:安全认证我们是因为kibana我们部署完没账密,需要用es本身的一个插件,实现账密安全登陆。
如下操作在其中一个node节点执行即可,生成完证书传到集群其他节点即可。
第一步,先生成证书

/usr/local/elasticsearch/bin/elasticsearch-certutil ca

/usr/local/elasticsearch/bin/elasticsearch-certutil cert --ca elastic-stack-ca.p12


两条命令均一路回车即可,不需要给秘钥再添加密码。

证书创建完成之后,默认在es的数据目录,这里统一放到config下:


cd /usr/local/elasticsearch/

mkdir -p config/certs/

mv elastic-certificates.p12 elastic-stack-ca.p12 config/certs/


拷贝到另外两台机器

scp -r certs/ root@192.168.66.131:/usr/local/elasticsearch/config/


scp -r certs/ root@192.168.66.132:/usr/local/elasticsearch/config/
第二步,配置es的config文件,三台服务器加上以下配置

xpack.security.enabled: true

xpack.security.transport.ssl.enabled: true

xpack.security.authc.accept_default_password: true

xpack.security.transport.ssl.verification_mode: certificate

xpack.security.transport.ssl.keystore.path: certs/elastic-certificates.p12

xpack.security.transport.ssl.truststore.path: certs/elastic-certificates.p12
如上配置无误,则可以启动es。
第三步,为内置账号添加密码

ES中内置了几个管理其他集成组件的账号即:apm_system, beats_system, elastic, kibana, logstash_system, remote_monitoring_user,使用之前,首先需要添加一下密码,密码可以设置成同一个,不然比较难记

· interactive:给用户一一设置密码。

· auto:自动生成密码。


/usr/local/elasticsearch/bin/elasticsearch-setup-passwords interactive


You will be prompted to enter passwords as the process progresses.

Please confirm that you would like to continue [y/N]y

Enter password for [elastic]:

Reenter password for [elastic]:

Enter password for [apm_system]:

Reenter password for [apm_system]:

Enter password for [kibana]:

Reenter password for [kibana]:

Enter password for [logstash_system]:

Reenter password for [logstash_system]:

Enter password for [beats_system]:

Reenter password for [beats_system]:

Enter password for [remote_monitoring_user]:

Reenter password for [remote_monitoring_user]:

Changed password for user [apm_system]

Changed password for user [kibana]

Changed password for user [logstash_system]

Changed password for user [beats_system]

Changed password for user [remote_monitoring_user]

Changed password for user [elastic]
到这里就安全认证就完成了,然后接下来就是把密码配置到kibana
2. kibana部署
2.1.下载安装包
cd /usr/local/src

wget https://artifacts.elastic.co/downloads/kibana/kibana-7.13.0-linux-x86_64.tar.gz
2.2.配置config
tar zxf kibana-7.13.0-linux-x86_64.tar.gz

mv kibana-7.13.0 /usr/local/kibana

cd /usr/local/kibana
vim config/kibana.yml

server.port: 5601

elasticsearch.hosts: ["http://192.168.66.130:9200"]

kibana.index: ".kibana"

server.host: "0.0.0.0"

elasticsearch.username: "elastic"

elasticsearch.password: "123321"
2.2.3.启动kibana
cd /usr/local/kibana

nohup bin/kibana &
3. kafka集群部署
启动kafka之前,需要先安装zookeeper集群
3.1.下载安装包
3.2.安装zookeeper
三台机器同时操作
使用kafka的内置zookeeper进行配置

cd /usr/local/src

tar zxf kafka_2.13-2.6.0.tgz

mv kafka_2.13-2.6.0 ../kafka
3.3.配置config
三台机器同时f复制如下操作配置
vim config/zookeeper.properties
dataDir=/data/zookeeper

# the port at which the clients will connect

clientPort=2181

# disable the per-ip limit on the number of connections since this is a non-production config

#maxClientCnxns=0

tickTime=2000

initLimit=10

syncLimit=5

# Disable the adminserver by default to avoid port conflicts.

# Set the port to something non-conflicting if choosing to enable this

#admin.enableServer=false

#admin.serverPort=8080


server.1=192.168.66.130:2888:3888

server.2=192.168.66.131:2888:3888

server.3=192.168.66.132:2888:3888
192.168.66.130
mkdir /data/zookeeper

echo 1 > /data/zookeeper/myid
192.168.66.131
mkdir /data/zookeeper

echo 2 > /data/zookeeper/myid
192.168.66.132
mkdir /data/zookeeper

echo 3 > /data/zookeeper/myid
3.4.启动zookeeper
bin/zookeeper-server-start.sh -daemon config/zookeeper.properties

查看日志

bin/kafka-server-start.sh -daemon config/server.properties
3.5.配置kafka
192.168.66.130
cd /usr/local/kafka

vim config/server.properties
broker.id=0

advertised.listeners=PLAINTEXT://192.168.66.130:9092

num.network.threads=3

num.io.threads=8

socket.send.buffer.bytes=102400

socket.receive.buffer.bytes=102400

socket.request.max.bytes=104857600

log.dirs=/usr/local/kafka/logs

num.partitions=1

num.recovery.threads.per.data.dir=1

offsets.topic.replication.factor=1

transaction.state.log.replication.factor=1

transaction.state.log.min.isr=1

log.retention.hours=168

log.segment.bytes=1073741824

log.retention.check.interval.ms=300000

zookeeper.connect=192.168.66.130:2181,192.168.66.131:2181,192.168.66.132:2181

zookeeper.connection.timeout.ms=18000

group.initial.rebalance.delay.ms=0

auto.create.topics.enable = true
192.168.66.131
cd /usr/local/kafka

vim config/server.properties
broker.id=0

advertised.listeners=PLAINTEXT://192.168.66.131:9092

num.network.threads=3

num.io.threads=8

socket.send.buffer.bytes=102400

socket.receive.buffer.bytes=102400

socket.request.max.bytes=104857600

log.dirs=/usr/local/kafka/logs

num.partitions=1

num.recovery.threads.per.data.dir=1

offsets.topic.replication.factor=1

transaction.state.log.replication.factor=1

transaction.state.log.min.isr=1

log.retention.hours=168

log.segment.bytes=1073741824

log.retention.check.interval.ms=300000

zookeeper.connect=192.168.66.130:2181,192.168.66.131:2181,192.168.66.132:2181

zookeeper.connection.timeout.ms=18000

group.initial.rebalance.delay.ms=0

auto.create.topics.enable = true
192.168.66.132
cd /usr/local/kafka

vim config/server.properties
broker.id=0

advertised.listeners=PLAINTEXT://192.168.66.132:9092

num.network.threads=3

num.io.threads=8

socket.send.buffer.bytes=102400

socket.receive.buffer.bytes=102400

socket.request.max.bytes=104857600

log.dirs=/usr/local/kafka/logs

num.partitions=1

num.recovery.threads.per.data.dir=1

offsets.topic.replication.factor=1

transaction.state.log.replication.factor=1

transaction.state.log.min.isr=1

log.retention.hours=168

log.segment.bytes=1073741824

log.retention.check.interval.ms=300000

zookeeper.connect=192.168.66.130:2181,192.168.66.131:2181,192.168.66.132:2181

zookeeper.connection.timeout.ms=18000

group.initial.rebalance.delay.ms=0

auto.create.topics.enable = true
4.6.启动kafka
cd /usr/local/kafka

bin/kafka-server-start.sh -daemon config/server.properties
4. logstash部署
4.1.配置
192.168.66.130和192.168.66.131
cd /usr/local/src

tar zvf logstash-7.13.0-linux-x86_64.tar.gz

mv logstash-7.13.0 ../logstash

cd /us/local/logstash

[root@localhost logstash]# cat logstash.conf
input {

    kafka {

        bootstrap_servers => "192.168.66.130:9092,192.168.66.131:9092,192.168.66.132:9092"

        topics_pattern => ["elk-.*"]

        codec => "json"

        consumer_threads => 5

        decorate_events => true

        auto_offset_reset => "latest"

    }

}

filter {

}

output {

            elasticsearch{

                    hosts => ["192.168.66.130:9200","192.168.66.131:9200","192.168.66.132:9200"]

                    index =>  "%{[@metadata][kafka][topic]}-%{+YYYY-MM-dd}"

                    user => "elastic"

                    password => "123321"

            }

    stdout { codec => rubydebug }

}
4.2.启动
cd /usr/local/logstash

nohup bin/logstash logstash.conf &
5.filebeat部署
5.1配置
192.168.66.132
业务机收集日志
[root@localhost filebeat]# cat  filebeat.yml

filebeat.inputs:

- type: log

  enabled: true

  paths:

    - /var/log/messages

  fields:

    topic: messages

  #tags: ["messages132"]

- type: log

  paths:

    - /var/log/test.log

  fields:

    topic: test-log

  multiline.pattern: '^20'  #正则匹配20开头的日志

  #multiline.pattern: '^\d{4}-\d{1,2}-\d{1,2}\s\d{1,2}:\d{1,2}:\d{1,2}'  #正则匹配,这种格式的都能匹配到2021-08-13 21:09:00

  multiline.negate:  true

  multiline.match: after


output.kafka:


  hosts: ["192.168.66.130:9092", "192.168.66.131:9092", "192.168.66.132:9092"]

  topic: 'elk-%{[fields.topic]}'

  partition.round_robin:

  reachable_only: false

  required_acks: 1

  compression: gzip

  max_message_bytes: 1000000


processors:

  - add_host_metadata:

      when.not.contains.tags: forwarded

  - add_cloud_metadata: ~

  - add_docker_metadata: ~

  - add_kubernetes_metadata: ~
5.2启动
./filebeat -e -c filebeat.yml
