1.手动构造数组
import numpy as np
import seaborn as sns
import matplotlib.pyplot as plt
import math
from matplotlib import cm
def visualize_2D(array, vmax, vmin):

    fig_width = math.ceil(array.shape[1] * 0.5)
    fig_length = math.ceil(array.shape[0] * 0.5)

    fig, ax = plt.subplots(figsize = (fig_width, fig_length))

    sns.heatmap(array,
               vmax = vmax,
               vmin = vmin,
               annot = True,
               fmt = '.0f',
               square = True,
               cmap = 'RdYlBu_r',
               linewidth = .5,
               cbar = False,
               xticklabels = False,
               yticklabels = False,
               ax = ax)

def visual_1D(array):
    fix, ax = plt.subplots()

    colors = cm.RdYlBu_r(np.linspace(0, 1, len(array)))

    for idx,num in enumerate(array):
        circle_idx = plt.Circle((idx, 0 ),
                                0.5,
                               facecolor = colors[idx],
                               edgecolor = 'w')
        ax.add_patch(circle_idx)
        ax.text(idx, 0, s = str(array[idx]),
                horizontalalignment = 'center',
                verticalalignment = 'center'
               )
    ax.set_xlim(-0.6, 0.6 + len(array))
    ax.set_ylim(-0.6, 0.6)
    ax.set_aspect('equal', adjustable = 'box')
1.一维数组的生成
a_1D = np.array(range(-1,8))
print(a_1D)
print(a_1D.shape)
print(len(a_1D))
print(a_1D.size)
print(a_1D.ndim)
visual_1D(a_1D)
[-1  0  1  2  3  4  5  6  7]
(9,)
9
9
1
![png]()
2.二维数组的生成
a_2D = np.array([[1,-1,3],[2,3,-9]])
print(a_2D)        #生成的数组
print(a_2D.shape)  #数组的形状
print(len(a_2D))   #数组的长度
print(a_2D.size)   #数组的大小
print(a_2D.ndim)   #数组的维度
visualize_2D(a_2D,1,-9)
[[ 1 -1  3]
 [ 2  3 -9]]
(2, 3)
2
6
2
![png]()
3.三维数组的生成
a_3D = np.array([[[1,-1,3],
                 [2,3,-9]],
                [[0,-1,8],
                 [2,3,-1]]])
print(a_3D)
print(a_3D.shape)
print(len(a_3D))
print(a_3D.size)
print(a_3D.ndim)
visualize_2D(a_3D[0],9,-1)
visualize_2D(a_3D[1],9,-1)
[[[ 1 -1  3]
  [ 2  3 -9]]

 [[ 0 -1  8]
  [ 2  3 -1]]]
(2, 2, 3)
2
12
3
![png]()
![png]()
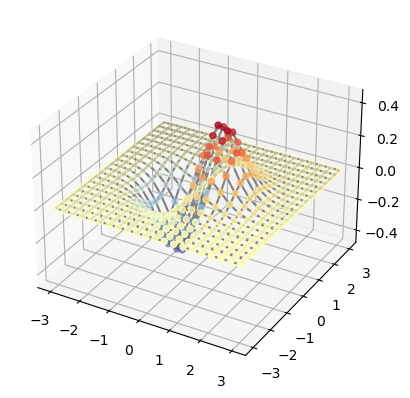
2.网格数据的生成
import numpy as np
import matplotlib.pyplot as plt

x1_array = np.linspace(-3, 3, 21)
x2_array = np.linspace(-3, 3, 21)

xx1, xx2 = np.meshgrid(x1_array, x2_array) # 分离数组
print(x2_array.shape,x1_array.shape,xx1.shape)

# 二次函数
ff =  xx1 * np.exp(-xx1**2 - xx2**2)

fig = plt.figure()
ax = fig.add_subplot(projection = '3d')

ax.plot_wireframe(xx1,xx2,ff,color = 'grey',
                 rstride = 1,
                 cstride = 1
                 )
ax.scatter(xx1, xx2, ff, c = ff, cmap = 'RdYlBu_r')
# ax.set_proj_type('ortho')
plt.show()
(21,) (21,) (21, 21)
![png]()
3.特殊数组
构造单位矩阵
a = np.eye(5)
visualize_2D(a,1,0)
# visualize_2D(np.empty_like(a),1,0) #
![png]()
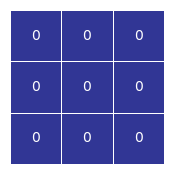
构造固定值填充的矩阵
visualize_2D(np.full((3,3), 0),0,0)
![png]()
A = np.array([[1, 2, 3],
              [4, 5, 6]])
np.full_like(A, 100)
array([[100, 100, 100],
       [100, 100, 100]])
构造全1矩阵
np.ones(5)
array([1., 1., 1., 1., 1.])
np.ones((5,5))
A = np.array([[1, 2, 3],
              [4, 5, 6]])
np.ones_like(A)
构造全0矩阵
np.zeros(5)
np.zeros((5,5))
A = np.array([[1, 2, 3],
              [4, 5, 6]])
np.zeros_like(A)
array([[0, 0, 0],
       [0, 0, 0]])


 浙公网安备 33010602011771号