Prometheus监控MySQL和Linux主机结合Grafana出图
监控的命令
top
df
free
htop
uptime
cat /proc/meminfo
iftop         流量监控工具
nethogs       查看进程占用的网络带宽
iotop
Prometheus
容器的名称和IP是在不断的变化,传统的监控软件无一例外的是基于IP的。Prometheus是一款专门为容器监控而生的软件,同时其内部使用了TSDB时间序列数据库
时序数据库:是利用时间标签来存储数据,其在处理大数据场景下,比关系型数据库的性能要强悍很多。
对比(插件的监控软件):
- Zabbix(PHP + MySQL)
- Zabbix在监控大规模机器的情况下,怎样优化其性能
- Prometheus(Golang + TSDB)
- TSDB比传统的数据性能要好
- Prometheus是原生支持容器化监控
- Open-falcon(Golang + MySQL )
- 阿里云云监控
Prometheus的架构图

采集数据
- 使用exporter
- PushGateway
保存数据
- 保存在TSDB之上
展示数据
- 展示数据
- Grafana是一款专业的数据量化软件
- 报警
- AlterManager
- 企业微信报警
- 钉钉报警
- 邮件报警
- 短信报警
- AlterManager
部署prometheus
1.server
#下载
[root@prometheus ~]# wget https://github.com/prometheus/prometheus/releases/download/v2.31.1/prometheus-2.31.1.linux-amd64.tar.gz

#安装
[root@prometheus ~]# tar xf prometheus-2.31.1.linux-amd64.tar.gz -C /usr/local/
[root@prometheus ~]# ln -s /usr/local/prometheus-2.31.1.linux-amd64 /usr/local/prometheus

#配置环境变量
[root@prometheus ~]# vim /etc/profile.d/prometheus.sh
export PATH=/usr/local/prometheus:$PATH
[root@prometheus ~]# source /etc/profile

# 启动(测试)
[root@promethues /usr/local/prometheus]# prometheus --config.file="/usr/local/prometheus/prometheus.yml"

#注册systemd服务
[root@prometheus ~]# vim /usr/lib/systemd/system/prometheus.service
[Unit]
Description=Prometheus

[Service]
EnvironmentFile=/usr/local/prometheus/prometheus.yml
ExecStart=/usr/local/prometheus/prometheus --config.file=/usr/local/prometheus/prometheus.yml --web.enable-lifecycle
Restart=on-failure

[Install]
WantedBy=multi-user.target

[root@prometheus ~]# systemctl daemon-reload
[root@prometheus ~]# systemctl enable --now prometheus

#目录说明
[root@promethus /usr/local/prometheus]# ls
console_libraries       --->控制台函数库
consoles                --->控制台
data                    --->数据存放目录

LICENSE                 --->许可证
NOTICE                  --->通知
prometheus              --->启动脚本
prometheus.yml          --->主配置文件
promtool                --->系统工具

#主配置文件说明
[root@promethus /usr/local/prometheus]# cat prometheus.yml

global:                 --->全局变量
  scrape_interval:     15s # 抓取时间间隔,每隔15秒去抓取一次
  evaluation_interval: 15s # 监控数据评估间隔

scrape_configs:
  - job_name: 'prometheus'           --->定义job名字

    static_configs:
    - targets: ['localhost:9090','web01:9100','10.0.0.8:9100']    --->定义监控节点

#检测
[root@prometheus ~]# netstat -lntp | grep prometheus
tcp6       0      0 :::9090                 :::*                    LISTEN      8280/prometheus

#浏览器访问10.0.0.61:9090
2.安装主机监控Agent
[root@prometheus ~]# wget https://github.com/prometheus/node_exporter/releases/download/v1.3.0/node_exporter-1.3.0.linux-amd64.tar.gz
[root@prometheus ~]# tar xf node_exporter-1.3.0.linux-amd64.tar.gz -C /usr/local/
[root@prometheus ~]# ln -s /usr/local/node_exporter-1.3.0.linux-amd64 /usr/local/node_exporter
[root@prometheus ~]# cat > /etc/profile.d/node_exporter.sh <<EOF
export PATH=/usr/local/node_exporter:$PATH
EOF
[root@prometheus ~]# source /etc/profile
#注册systemd服务
[root@prometheus ~]# cat > /usr/lib/systemd/system/node_exporterd.service << EOF
[Unit]
Description=This is prometheus node exporter
After=node_exporter.service
[Service]
Type=simple
ExecStart=/usr/local/node_exporter/node_exporter
ExecReload=/bin/kill -HUP
KillMode=process
Restart=on-failure
[Install]
WantedBy=multi-user.target
EOF
[root@prometheus ~]# systemctl daemon-reload
[root@prometheus ~]# systemctl enable --now node_exporterd.service
#检验
[root@prometheus ~]# netstat -lntp | grep node_exporter
tcp6 0 0 :::9100 :::* LISTEN 8384/nod_exporter
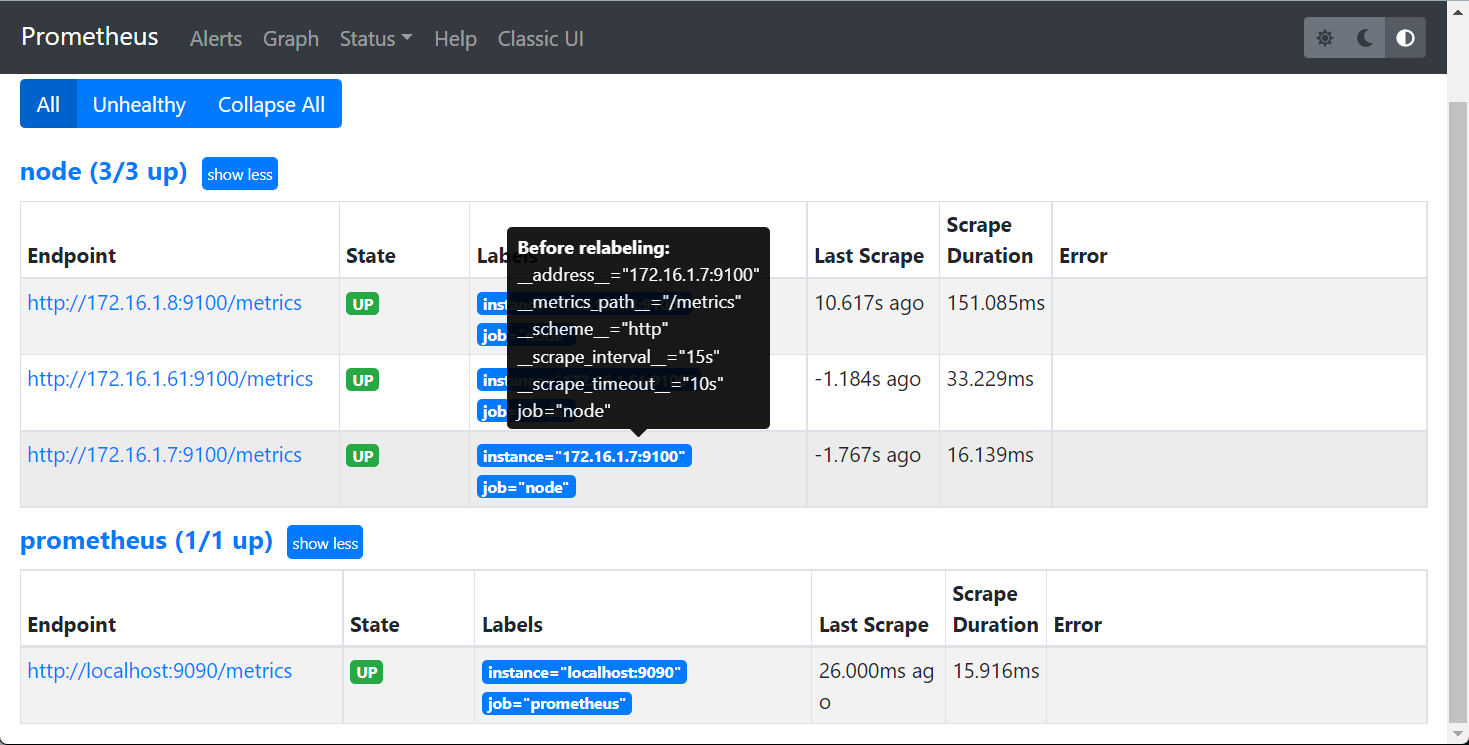
#将node_exporter加载到Prometheus中
#在配置文件中末尾添加如下
[root@prometheus ~]# vim /usr/local/prometheus/prometheus.yml
- job_name: "node"
static_configs:
#添加IP两种写法
- targets:["172.16.1.61:9100","172.16.1.7:9100","172.16.1.8:9100"]
# or
- targets:
- 172.16.1.61:9100
- 172.16.1.7:9100
- 172.16.1.8:9100
[root@prometheus ~]# systemctl restart prometheusd.service
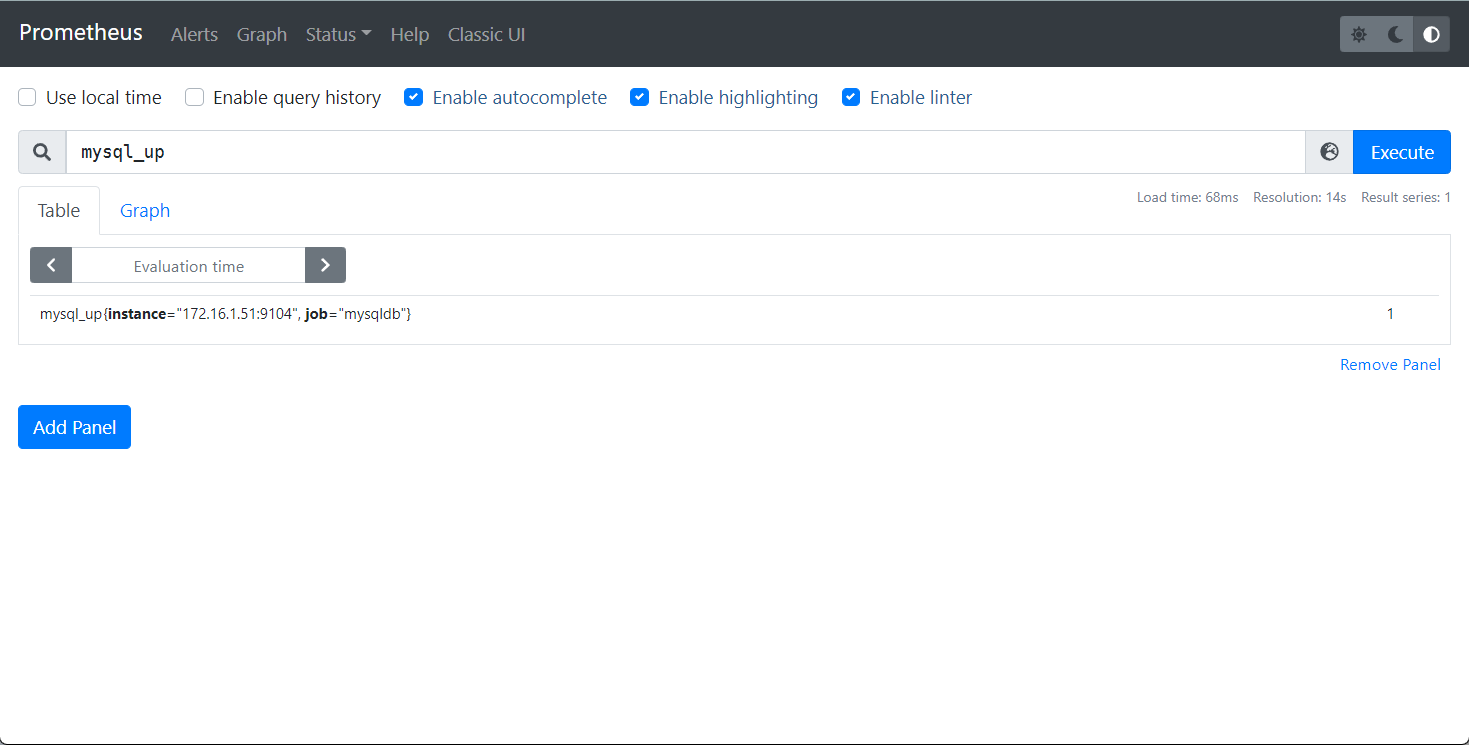
3.监控MySQL
[root@db01 ~]# wget https://github.com/prometheus/mysqld_exporter/releases/download/v0.13.0/mysqld_exporter-0.13.0.linux-amd64.tar.gz
[root@db01 ~]# tar xf mysqld_exporter-0.13.0.linux-amd64.tar.gz -C /usr/local/
[root@db01 ~]# ln -s /usr/local/mysqld_exporter-0.13.0.linux-amd64 /usr/local/mysqld_exporter
#授权用户
[root@db01 ~]# mysql
mysql> grant select,replication client,process ON *.* to 'mysql_exporter'@'172.16.1.51' identifieed by '123';
mysql> FLUSH PRIVILEGES;
## 创建⼀个mysql配置⽂件,写上连接的⽤户名与密码(和上⾯的授权的⽤户名 和密码要对应)
[root@db01 ~]# vim /usr/local/mysqld_exporter/.my.cnf
[client]
host=172.16.1.51
user=mysql_exporter
password=123
4、启动(测试)
[root@db01 ~]# /usr/local/mysqld_exporter/mysqld_exporter --config.my-cnf=/usr/local/mysqld_exporter/.my.cnf
#加入systemd
[root@db01 ~]# vim /usr/lib/systemd/system/mysql_exporter.service
[Unit]
Description=Prometheus
[Service]
ExecStart=/usr/local/mysqld_exporter/mysqld_exporter --config.my-cnf=/usr/local/mysqld_exporter/.my.cnf --web.listen-address=:9104
Restart=on-failure
[Install]
WantedBy=multi-user.target
[root@db01 ~]# systemctl daemon-reload
[root@db01 ~]# systemctl enable --now mysql_exporter
[root@db01 ~]# netstat -lntp | grep mysql
tcp6 0 0 :::3306 :::* LISTEN 1593/mysqld
tcp6 0 0 :::9104 :::* LISTEN 1942/mysqld_exporte
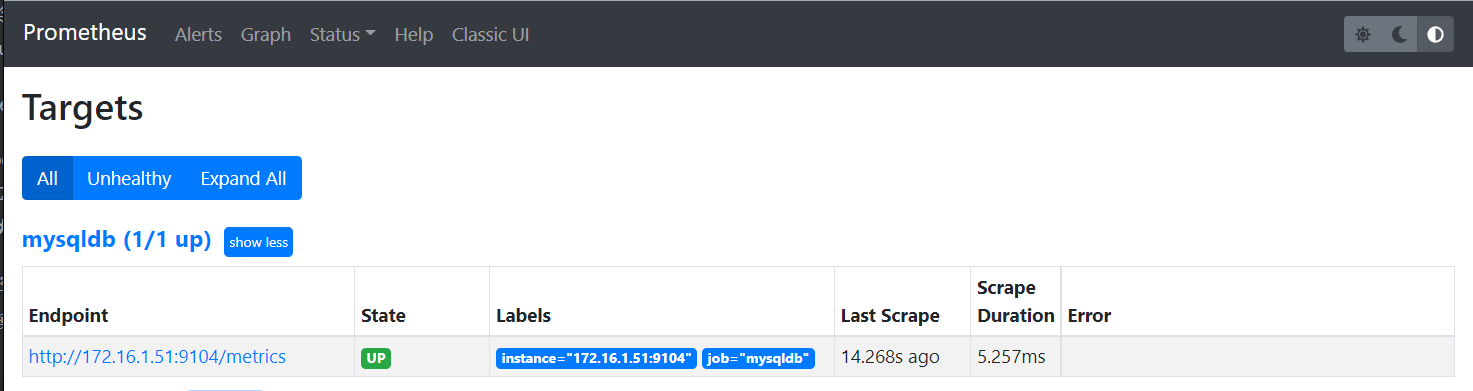
# 回到prometheus服务器的配置⽂件⾥添加被监控的mysql的配置段
[root@prometheus ~]# vim /usr/local/prometheus/prometheus.yml
- job_name: "mysqldb"
static_configs:
- targets: ["172.16.1.51:9104"]
[root@prometheus /usr/local]# systemctl restart prometheus
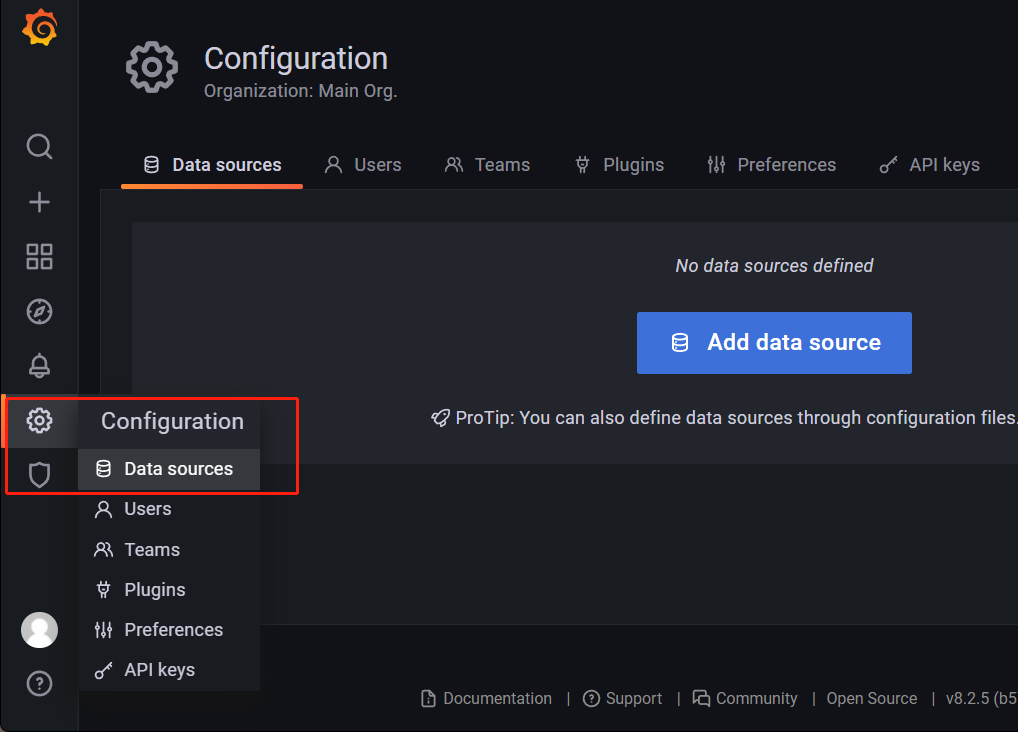
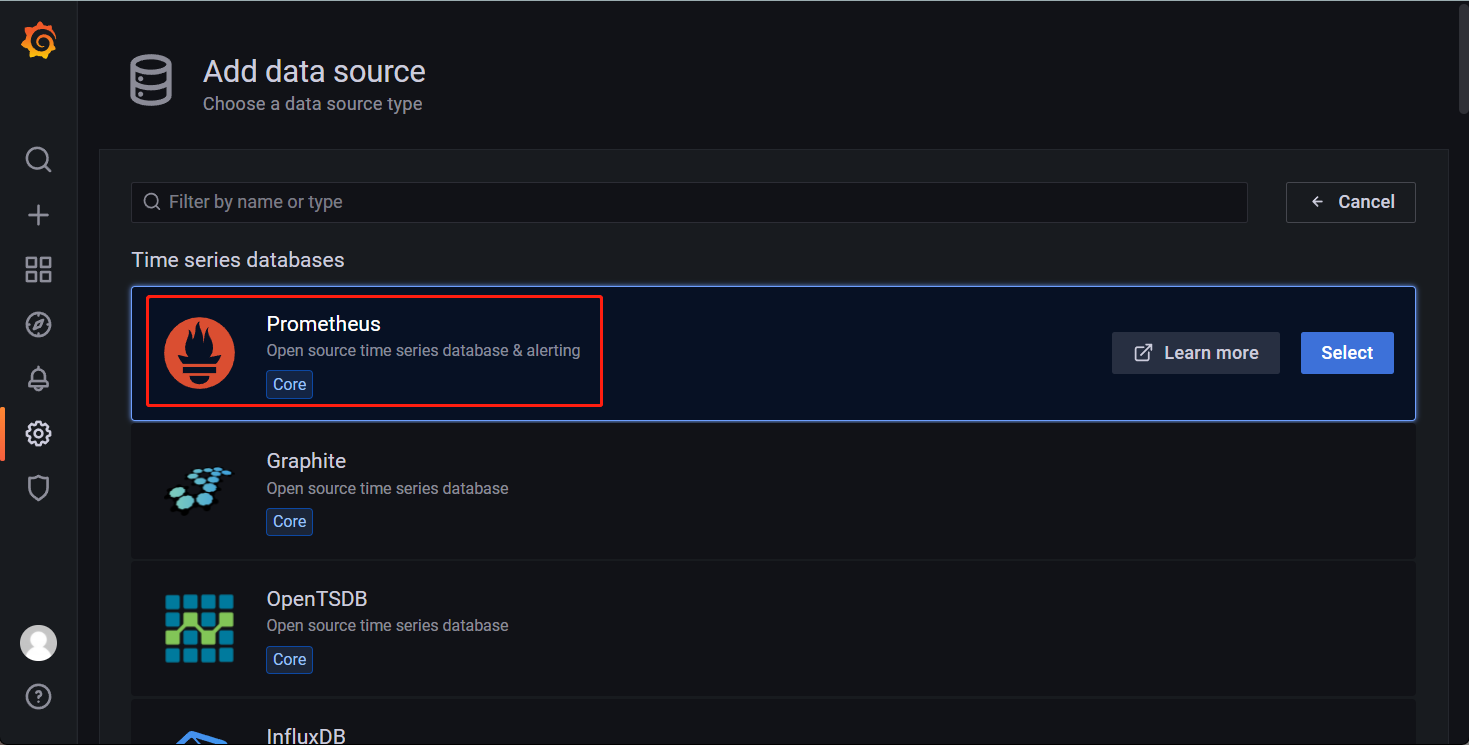
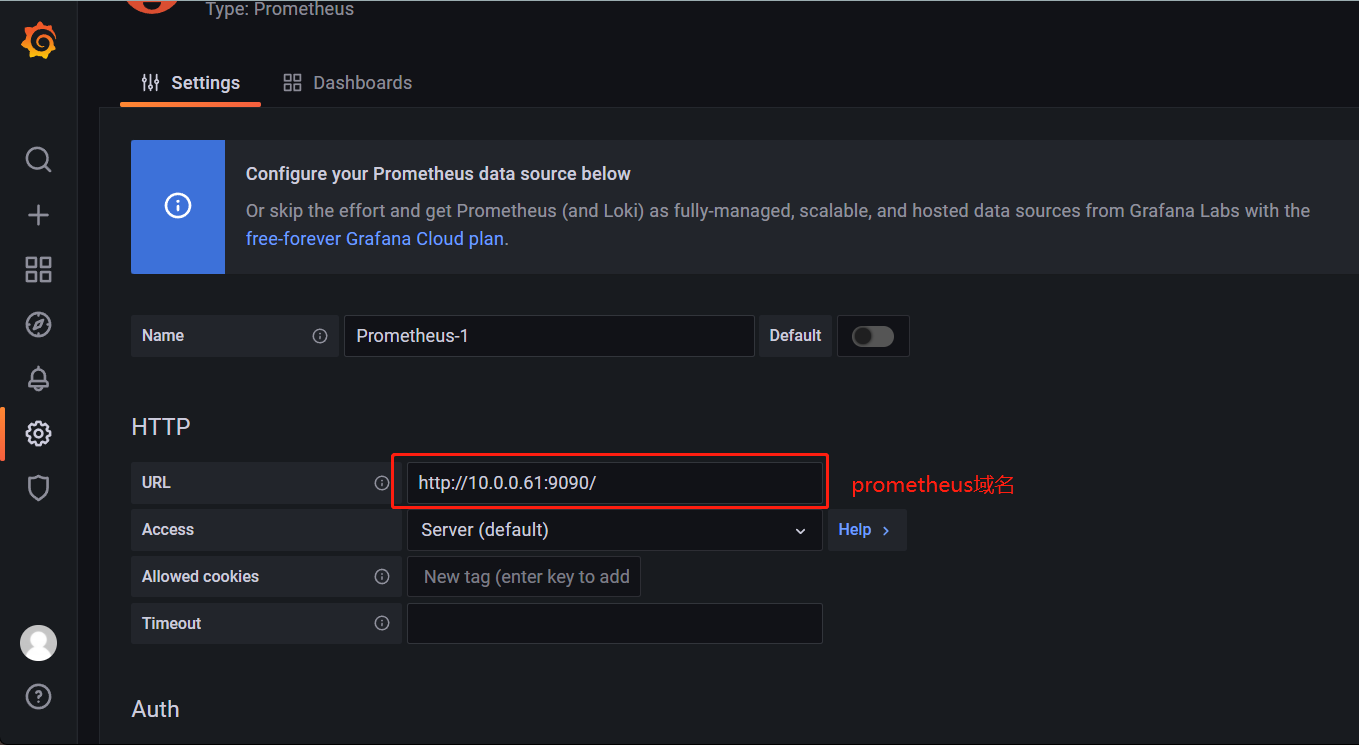
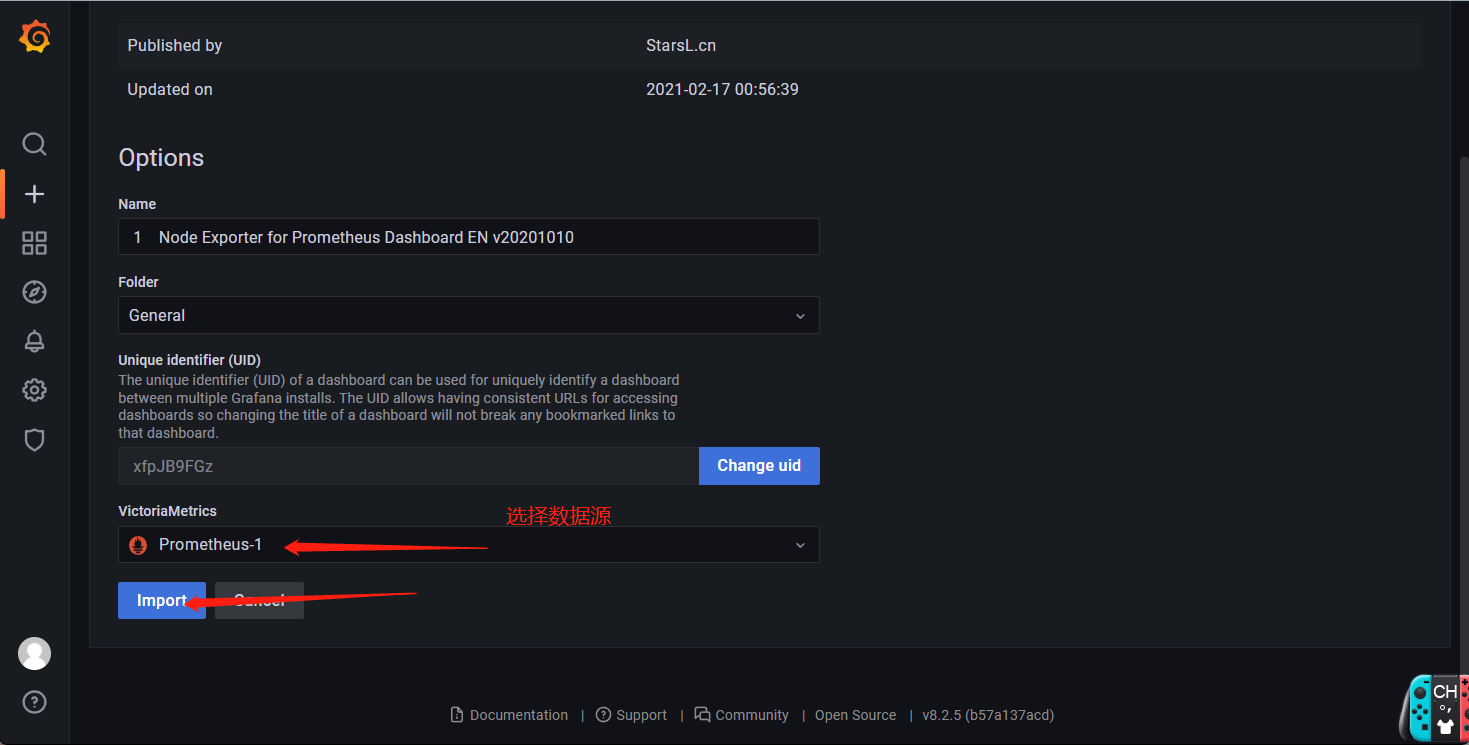
安装监控大屏(grafana)
Grafana是一款数字量化的软件,配合Prometheus展示服务器监控大屏。
[root@prometheus ~]# cat > /etc/yum.repos.d/grafana.repo << EOF
[grafana]
name=grafana
baseurl=https://mirrors.tuna.tsinghua.edu.cn/grafana/yum/rpm
repo_gpgcheck=0
enabled=1
gpgcheck=0
EOF
[root@prometheus ~]# yum makecache
[root@prometheus ~]# yum install -y grafana
[root@prometheus ~]# systemctl enable --now grafana-server.service

#浏览器访问 10.0.0.61:3000
#默认用户名密码:admin/admin
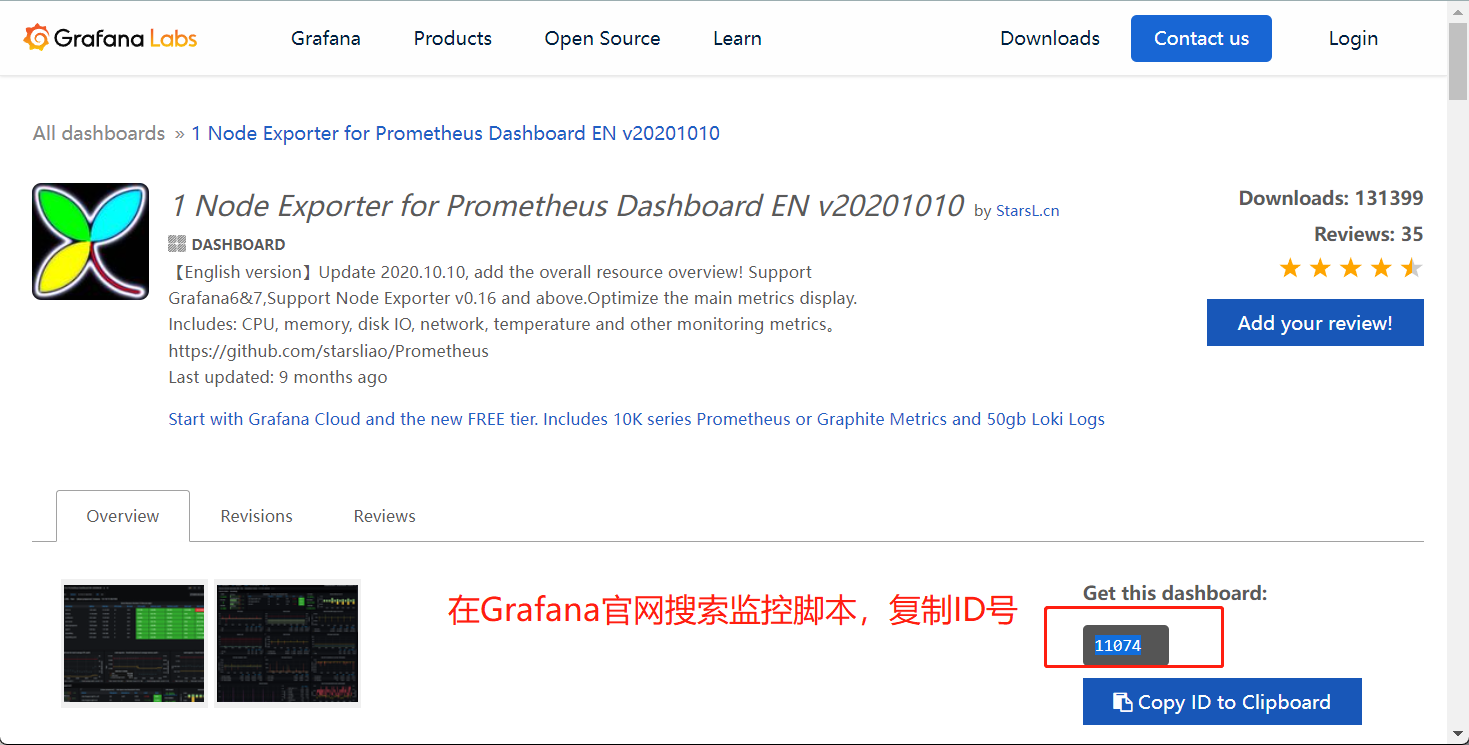
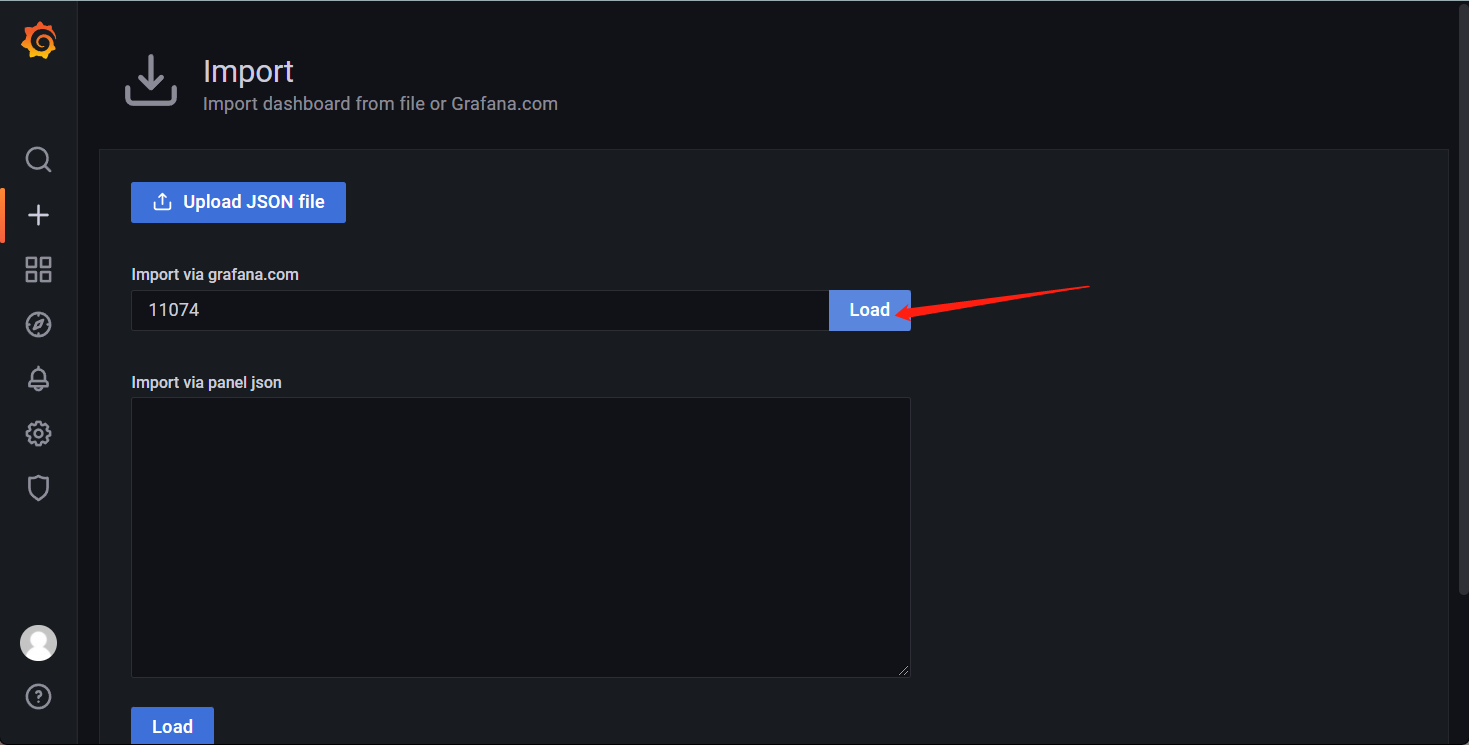
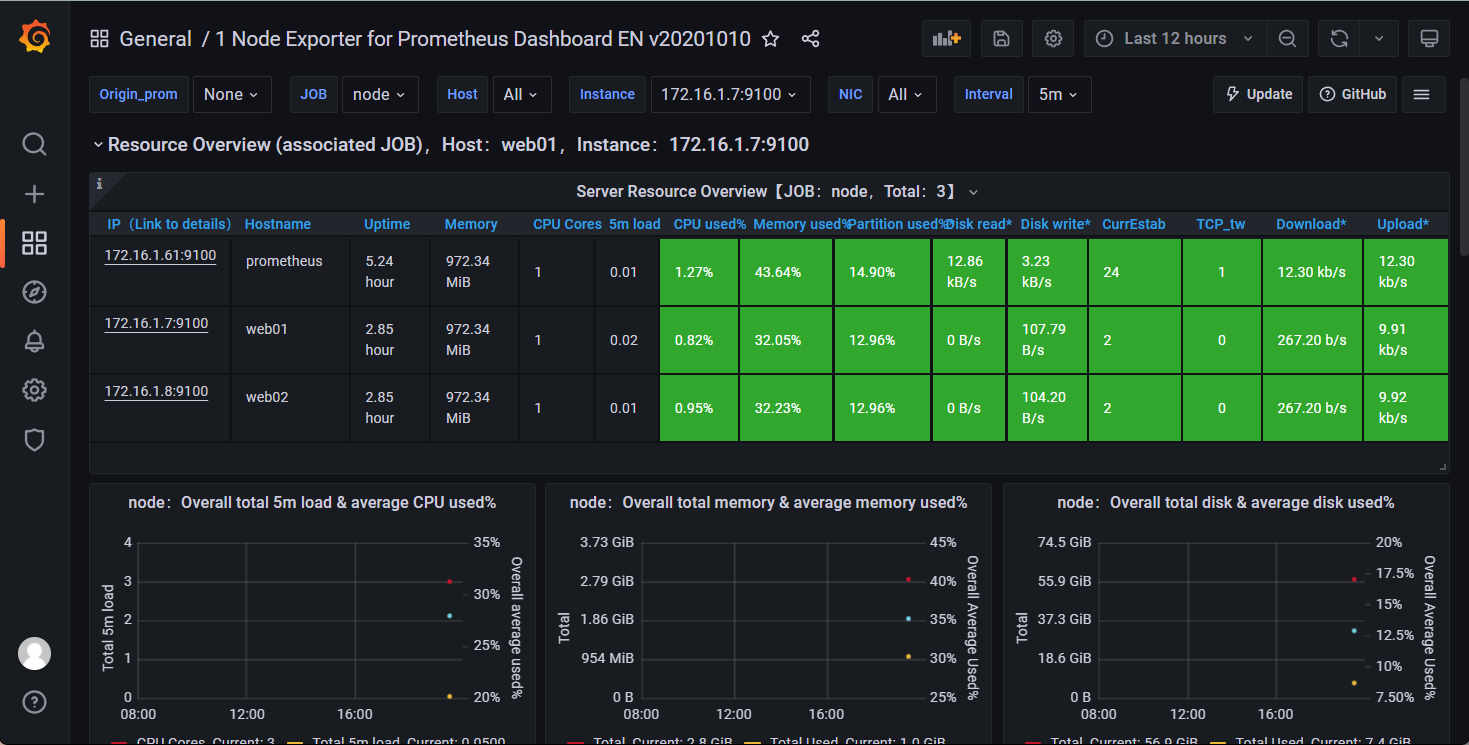
图形化监控


 浙公网安备 33010602011771号