

python工具——Scalene
Scalene 是一个 Python 的高性能 CPU内存分析器
用于Python脚本的CPU和内存分析器,能够正确处理多线程代码,还能区分Python代码和本机代码的运行时间
在linux或Mac OS X上运行
特点:
快速、开销少、精确
还能对高耗能的代码行进行标注
安装
pip install scalene
eg:
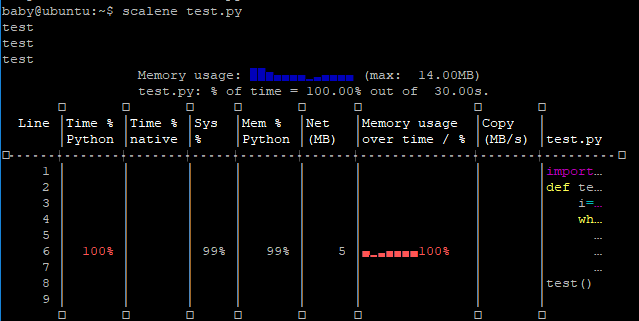
test.py
import time
def test():
    i=3;
    while i>0:
        print("test")
        time.sleep(10)
        i=i-1
test()
会生成一个文本形式的报告,显示出每一行代码的CPU和内存的使用情况
查看全部配置
python -m scalene --help
usage: scalene [-h] [--outfile OUTFILE] [--html] [--reduced-profile]
[--profile-interval PROFILE_INTERVAL] [--cpu-only]
[--profile-all] [--use-virtual-time]
[--cpu-percent-threshold CPU_PERCENT_THRESHOLD]
[--cpu-sampling-rate CPU_SAMPLING_RATE]
[--malloc-threshold MALLOC_THRESHOLD]
Scalene: a high-precision CPU and memory profiler.
https://github.com/emeryberger/scalene
% scalene yourprogram.py
optional arguments:
-h, --help show this help message and exit
--outfile OUTFILE file to hold profiler output (default: stdout)
--html output as HTML (default: text)
--reduced-profile generate a reduced profile, with non-zero lines only (default: False).
--profile-interval PROFILE_INTERVAL
output profiles every so many seconds.
--cpu-only only profile CPU time (default: profile CPU, memory, and copying)
--profile-all profile all executed code, not just the target program (default: only the target program)
--use-virtual-time measure only CPU time, not time spent in I/O or blocking (default: False)
--cpu-percent-threshold CPU_PERCENT_THRESHOLD
only report profiles with at least this percent of CPU time (default: 1%)
--cpu-sampling-rate CPU_SAMPLING_RATE
CPU sampling rate (default: every 0.01s)
--malloc-threshold MALLOC_THRESHOLD
only report profiles with at least this many allocations (default: 100)


【推荐】国内首个AI IDE,深度理解中文开发场景,立即下载体验Trae
【推荐】编程新体验,更懂你的AI,立即体验豆包MarsCode编程助手
【推荐】抖音旗下AI助手豆包,你的智能百科全书,全免费不限次数
【推荐】轻量又高性能的 SSH 工具 IShell:AI 加持,快人一步
· Linux系列:如何用heaptrack跟踪.NET程序的非托管内存泄露
· 开发者必知的日志记录最佳实践
· SQL Server 2025 AI相关能力初探
· Linux系列:如何用 C#调用 C方法造成内存泄露
· AI与.NET技术实操系列(二):开始使用ML.NET
· 无需6万激活码!GitHub神秘组织3小时极速复刻Manus,手把手教你使用OpenManus搭建本
· C#/.NET/.NET Core优秀项目和框架2025年2月简报
· 什么是nginx的强缓存和协商缓存
· 一文读懂知识蒸馏
· Manus爆火,是硬核还是营销?
2017-01-05 使用Amoeba for mysql实现mysql读写分离
2017-01-05 Mysql主从架构的复制
2017-01-05 Redis-Sentinel(Redis集群监控管理)
2016-01-05 GridView多表关联