matplotlib和numpy 学习笔记
1. 在二维坐标系中画一个曲线
import matplotlib.pyplot as plt

#data len=400, store int value
data = []

#set x,y轴坐标的范围
plt.axis([0, max(data), 0, 400])

#set value of the points
plt.plot(data, range(400), 'r-')

#反转Y坐标轴方向
plt.gca().invert_yaxis()

#设置x,y轴名称
plt.ylabel('line')
plt.xlabel('greySum')

plt.show()
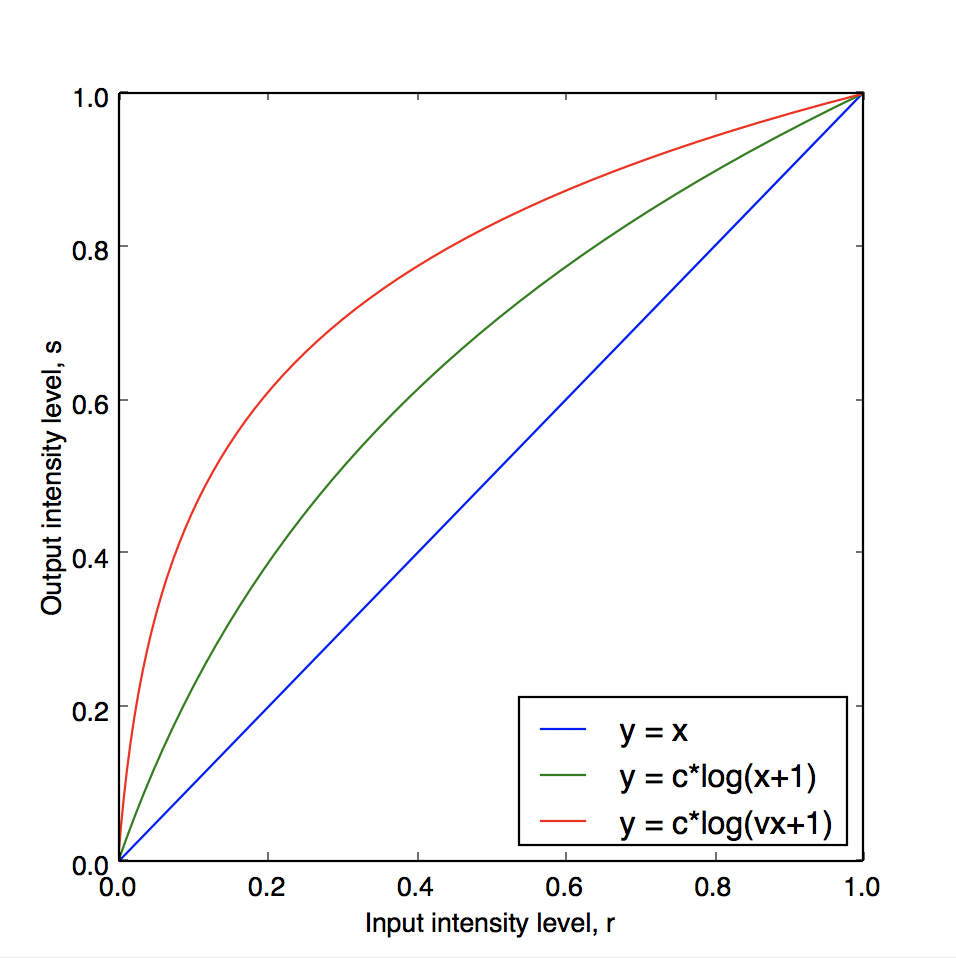
2. Log transformation
#!/usr/bin/python
import math
import matplotlib.pyplot as plt
import numpy as np


plt.figure(figsize=(6,6), facecolor='white')


x = np.arange(0.0, 1.0, 0.001)

y=[ t for t in x]
plt.plot(x,y)


v = 5
c = 1 / math.log(v+1)
y=[c * math.log(v*t+1) for t in x]
plt.plot(x,y)

v = 50
c = 1 / math.log(v+1)
y=[c * math.log(v*t+1) for t in x]
plt.plot(x,y)


plt.ylabel('Output intensity level, s')
plt.xlabel('Input intensity level, r')

plt.legend(['y = x', 'y = c*log(x+1)', 'y = c*log(vx+1)'], loc='lower right')

plt.show()


