CentOS7安装部署Prometheus和Grafana
Prometheus 是一款基于时序数据库的开源监控告警系统,说起 Prometheus 则不得不提 SoundCloud,这是一个在线音乐分享的平台,类似于做视频分享的 YouTube,由于他们在微服务架构的道路上越走越远,出现了成百上千的服务,使用传统的监控系统 StatsD 和 Graphite 存在大量的局限性,于是他们在 2012 年开始着手开发一套全新的监控系统。Prometheus 的原作者是 Matt T. Proud,他也是在 2012 年加入 SoundCloud 的,实际上,在加入 SoundCloud 之前,Matt 一直就职于 Google,他从 Google 的集群管理器 Borg 和它的监控系统 Borgmon 中获取灵感,开发了开源的监控系统 Prometheus,和 Google 的很多项目一样,使用的编程语言是 Go。
很显然,Prometheus 作为一个微服务架构监控系统的解决方案,它和容器也脱不开关系。早在 2006 年 8 月 9 日,Eric Schmidt 在搜索引擎大会上首次提出了云计算(Cloud Computing)的概念,在之后的十几年里,云计算的发展势如破竹。在 2013 年,Pivotal 的 Matt Stine 又提出了云原生(Cloud Native)的概念,云原生由微服务架构、DevOps 和以容器为代表的敏捷基础架构组成,帮助企业快速、持续、可靠、规模化地交付软件。为了统一云计算接口和相关标准,2015 年 7 月,隶属于 Linux 基金会的 云原生计算基金会(CNCF,Cloud Native Computing Foundation) 应运而生。第一个加入 CNCF 的项目是 Google 的 Kubernetes,而 Prometheus 是第二个加入的(2016 年)。
目前 Prometheus 已经广泛用于 Kubernetes 集群的监控系统中,对 Prometheus 的历史感兴趣的同学可以看看 SoundCloud 的工程师 Tobias Schmidt 在 2016 年的 PromCon 大会上的演讲:The History of Prometheus at SoundCloud 。
一、Prometheus 概述
我们在 SoundCloud 的官方博客中可以找到一篇关于他们为什么需要新开发一个监控系统的文章 Prometheus: Monitoring at SoundCloud,在这篇文章中,他们介绍到,他们需要的监控系统必须满足下面四个特性:
- A multi-dimensional data model, so that data can be sliced and diced at will, along dimensions like instance, service, endpoint, and method.
- Operational simplicity, so that you can spin up a monitoring server where and when you want, even on your local workstation, without setting up a distributed storage backend or reconfiguring the world.
- Scalable data collection and decentralized architecture, so that you can reliably monitor the many instances of your services, and independent teams can set up independent monitoring servers.
- Finally, a powerful query language that leverages the data model for meaningful alerting (including easy silencing) and graphing (for dashboards and for ad-hoc exploration).
简单来说,就是下面四个特性:
- 多维度数据模型
- 方便的部署和维护
- 灵活的数据采集
- 强大的查询语言
实际上,多维度数据模型和强大的查询语言这两个特性,正是时序数据库所要求的,所以 Prometheus 不仅仅是一个监控系统,同时也是一个时序数据库。那为什么 Prometheus 不直接使用现有的时序数据库作为后端存储呢?这是因为 SoundCloud 不仅希望他们的监控系统有着时序数据库的特点,而且还需要部署和维护非常方便。纵观比较流行的时序数据库(参见下面的附录),他们要么组件太多,要么外部依赖繁重,比如:Druid 有 Historical、MiddleManager、Broker、Coordinator、Overlord、Router 一堆的组件,而且还依赖于 ZooKeeper、Deep storage(HDFS 或 S3 等),Metadata store(PostgreSQL 或 MySQL),部署和维护起来成本非常高。而 Prometheus 采用去中心化架构,可以独立部署,不依赖于外部的分布式存储,你可以在几分钟的时间里就可以搭建出一套监控系统。
此外,Prometheus 数据采集方式也非常灵活。要采集目标的监控数据,首先需要在目标处安装数据采集组件,这被称之为 Exporter,它会在目标处收集监控数据,并暴露出一个 HTTP 接口供 Prometheus 查询,Prometheus 通过 Pull 的方式来采集数据,这和传统的 Push 模式不同。不过 Prometheus 也提供了一种方式来支持 Push 模式,你可以将你的数据推送到 Push Gateway,Prometheus 通过 Pull 的方式从 Push Gateway 获取数据。目前的 Exporter 已经可以采集绝大多数的第三方数据,比如 Docker、HAProxy、StatsD、JMX 等等,官网有一份 Exporter 的列表。
除了这四大特性,随着 Prometheus 的不断发展,开始支持越来越多的高级特性,比如:服务发现,更丰富的图表展示,使用外部存储,强大的告警规则和多样的通知方式。下图是 Prometheus 的整体架构图(图片来源):
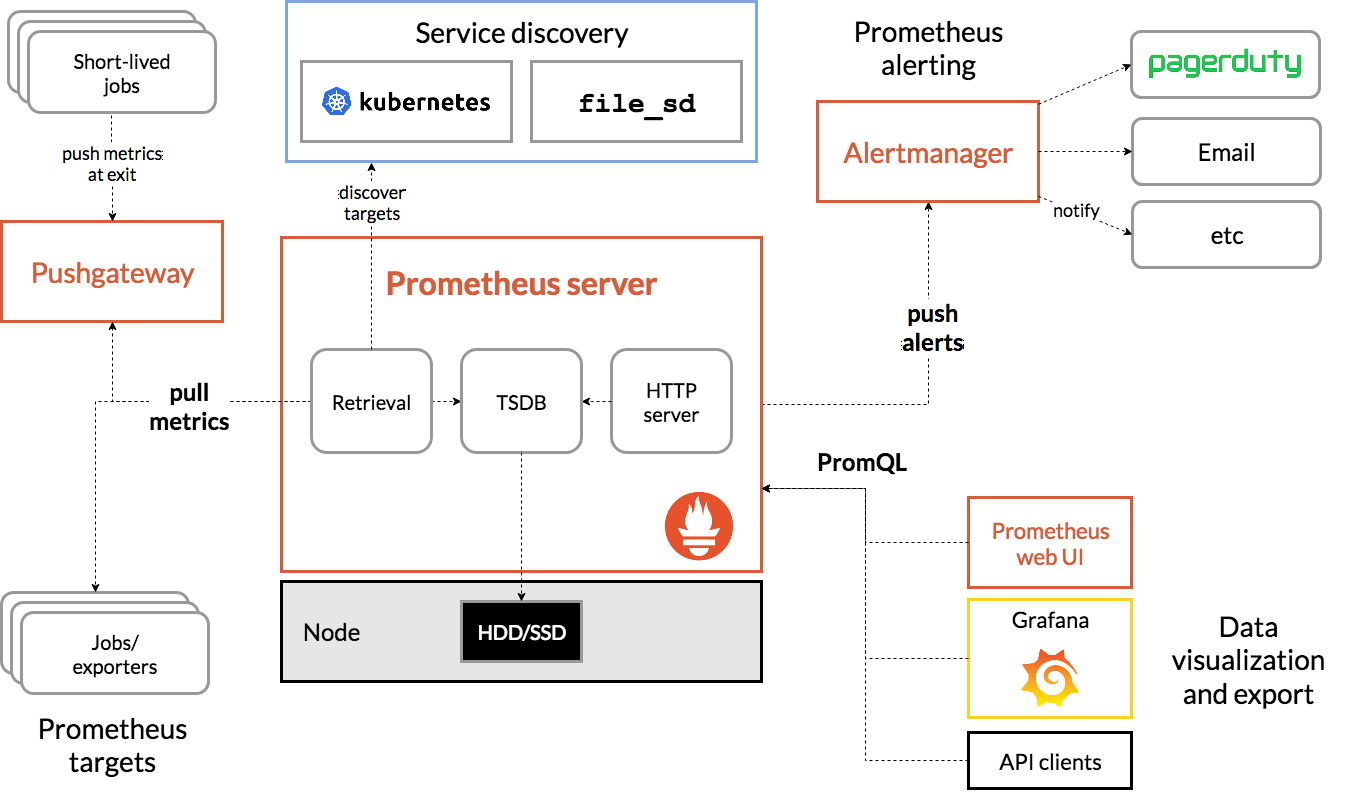
从上图可以看出,Prometheus 生态系统包含了几个关键的组件:Prometheus server、Pushgateway、Alertmanager、Web UI 等,但是大多数组件都不是必需的,其中最核心的组件当然是 Prometheus server,它负责收集和存储指标数据,支持表达式查询,和告警的生成。接下来我们就来安装 Prometheus server。
二、安装Prometheus Server
Prometheus基于Golang编写,编译后的软件包,不依赖于任何的第三方依赖。用户只需要下载对应平台的二进制包,解压并且添加基本的配置即可正常启Prometheus Server。
2.1 下载并解压二进制安装包
通过prometheus的官网,我们下载的prometheus是在2019年的版本。
#下载、解压、创建软链接
wget https://github.com/prometheus/prometheus/releases/download/v2.13.0/prometheus-2.13.0.linux-amd64.tar.gz
tar -xf prometheus-2.13.0.linux-amd64.tar.gz
mv prometheus-2.13.0.linux-amd64 /usr/local/
ln -s /usr/local/prometheus-2.13.0.linux-amd64/ /usr/local/prometheus
2.2 配置说明
解压后当前目录会包含默认的Prometheus配置文件promethes.yml,下面配置文件做下简略的解析:
# 全局配置
global:
  scrape_interval:     15s # 设置抓取间隔,默认为1分钟
  evaluation_interval: 15s #估算规则的默认周期,每15秒计算一次规则。默认1分钟
  # scrape_timeout  #默认抓取超时,默认为10s

# Alertmanager相关配置
alerting:
  alertmanagers:
  - static_configs:
    - targets:
      # - alertmanager:9093

# 规则文件列表,使用'evaluation_interval' 参数去抓取
rule_files:
  # - "first_rules.yml"
  # - "second_rules.yml"

#  抓取配置列表
scrape_configs:
  - job_name: 'prometheus'
    static_configs:
    - targets: ['localhost:9090']
2.3 创建prometheus的用户及数据存储目录
为了安全,我们使用普通用户来启动prometheus服务。作为一个时序型的数据库产品,prometheus的数据默认会存放在应用所在目录下,我们需要修改为 /data/prometheus下。
useradd  -s /sbin/nologin -M prometheus
mkdir  /data/prometheus -p
#修改目录属主
chown -R prometheus:prometheus /usr/local/prometheus/
chown -R prometheus:prometheus /data/prometheus/
2.4 创建Systemd服务启动prometheus
prometheus的启动很简单,只需要直接启动解压目录的二进制文件prometheus即可,但是为了更加方便对prometheus进行管理,这里使用systemd来启停prometheus
 vim /etc/systemd/system/prometheus.service

[Unit]
Description=Prometheus
Documentation=https://prometheus.io/
After=network.target
[Service]
Type=simple
User=prometheus
ExecStart=/usr/local/prometheus/prometheus --config.file=/usr/local/prometheus/prometheus.yml --storage.tsdb.path=/data/prometheus
Restart=on-failure
[Install]
WantedBy=multi-user.target
备注:在service文件里面,我们定义了启动的命令,定义了数据存储在/data/prometheus路径下,否则默认会在prometheus二进制的目录的data下。
systemctl start prometheus
systemctl status prometheus
systemctl enable prometheus
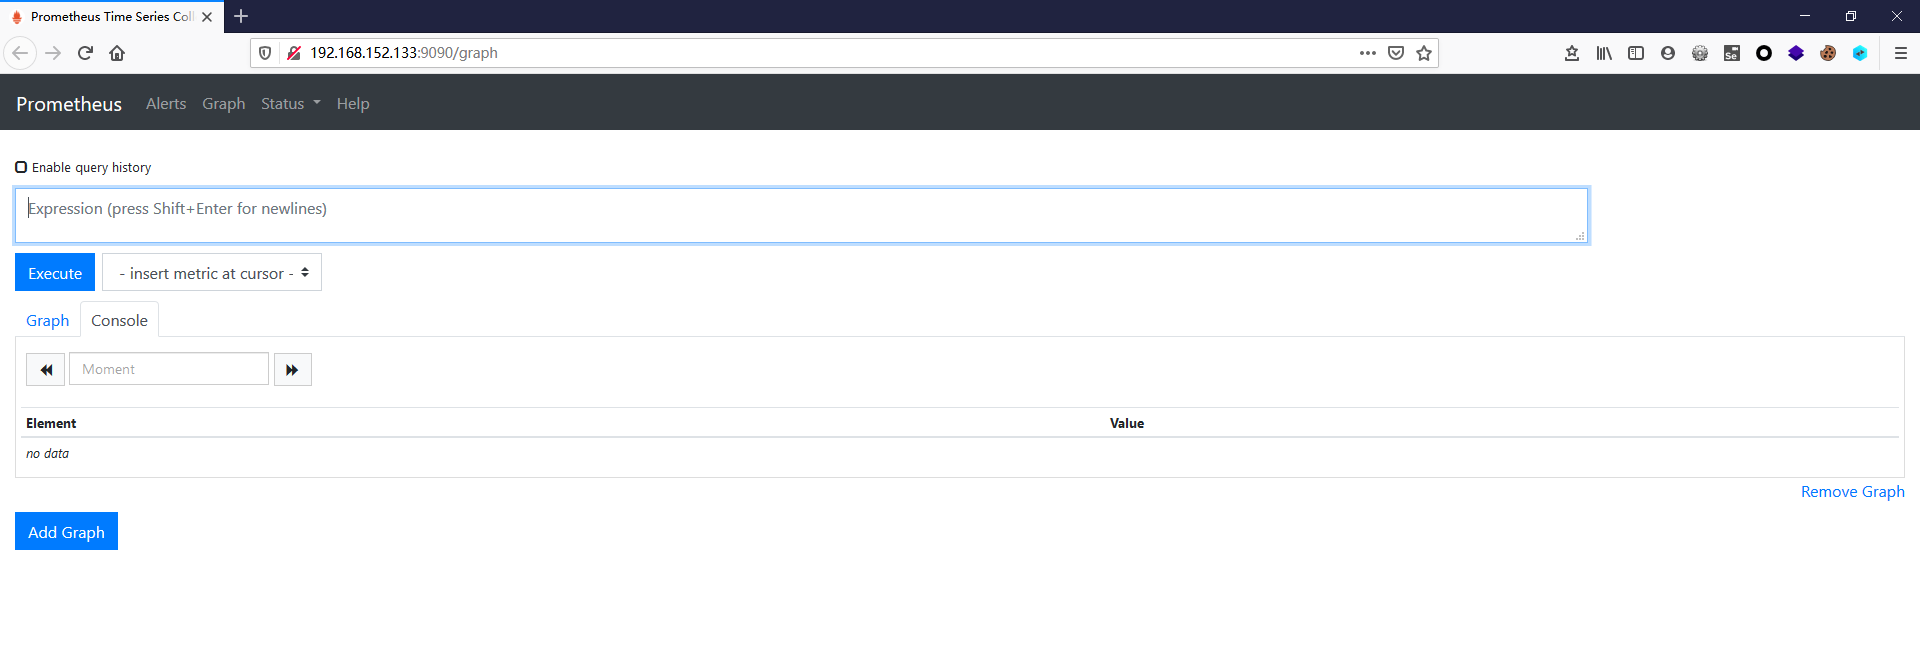
2.5 打开prometheus的web页面
到这里,prometheus就已经安装好了。prometheus启动后默认会启动9090端口,我们通过浏览器打开该端口页面
三、 Grafana的安装
虽然说prometheus能展示一些图表,但对比Grafana还是比较弱的。接下来我们需要在同一个服务器上安装Grafana服务,用来展示prometheus收集到的数据。
3.1 下载并解压二进制包
这里演示的Grafana的版本为6.4.2,要下载其他的版本可以到Grafana的官网进行下载。
wget https://dl.grafana.com/oss/release/grafana-6.4.2.linux-amd64.tar.gz
tar -zxvf grafana-6.4.2.linux-amd64.tar.gz
mv grafana-6.4.2  /usr/local/
ln -s /usr/local/grafana-6.4.2/ /usr/local/grafana
3.2 创建grafana用户及数据存放目录
useradd -s /sbin/nologin -M grafana
mkdir /data/grafana
chown -R grafana:grafana /usr/local/grafana/
chown -R grafana:grafana  /data/grafana/
3.3 修改配置文件
修改 /usr/local/grafana/conf/defaults.ini 文件,配置为上面新建的数据目录。
data = /data/grafana/data
logs = /data/grafana/log
plugins = /data/grafana/plugins
provisioning = /data/grafana/conf/provisioning
3.4 把grafana-server添加到systemd中
新增 grafana-server.service 文件,使用systemd来管理grafana服务
vim /etc/systemd/system/grafana-server.service

[Unit]
Description=Grafana
After=network.target

[Service]
User=grafana
Group=grafana
Type=notify
ExecStart=/usr/local/grafana/bin/grafana-server -homepath /usr/local/grafana
Restart=on-failure

[Install]
WantedBy=multi-user.target
启停并设置开机启动
systemctl start  grafana-server
systemctl status  grafana-server
systemctl enable  grafana-server
3.5 打开grafana的web页面
到这里,grafana已经安装完毕。默认情况下,grafana-server会启动3000端口,我们使用浏览器打开grafana页面,然后输入默认的账号密码 admin/admin登录。
3.6 添加数据源
grafana虽然已经安装好了,但是这个时候还没有数据,没办法作图。下面我们把grafana和prometheus关联起来,也就是在grafana中添加添加数据源。
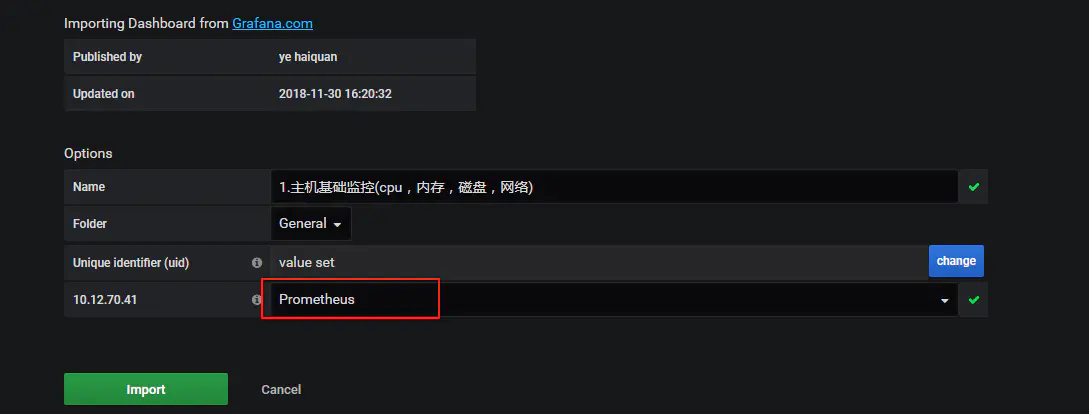
在配置页面点击添加数据源,然后选择prometheus,输入prometheus服务的参数即可。
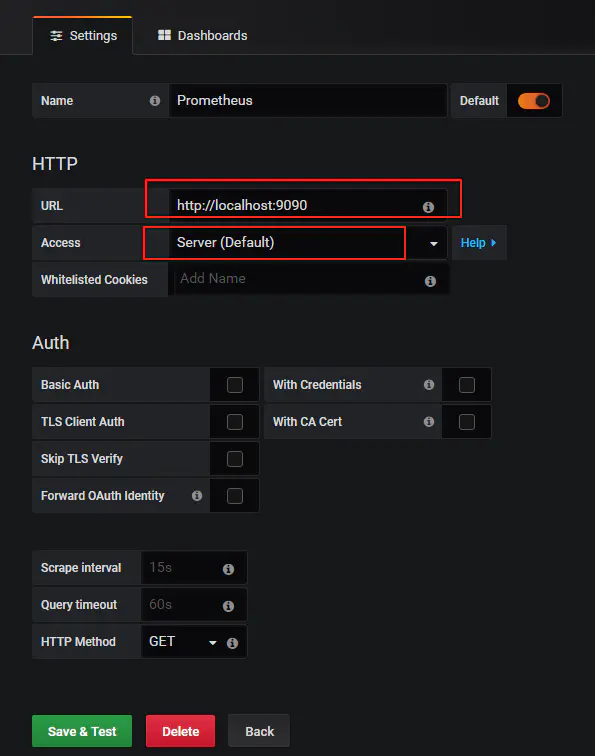
按照上图示例添加数据源之后,点击save & test就可以了。
3.7 添加自带的示例图表
按照上面的指导添加数据源之后,我们就可以针对这些数据来绘制图表了。grafana最人性化的一点就是拥有大量的图表模板,我们只需要导入模板即可,从而省去了大量的制作图表的时间。
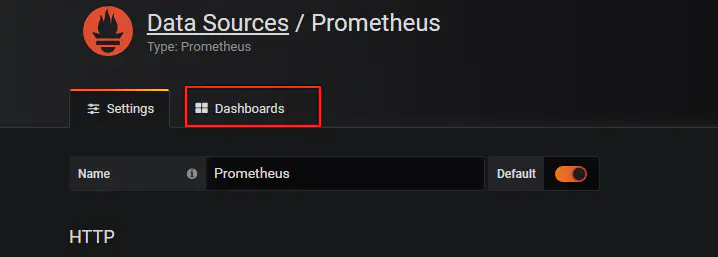
目前我们的prometheus还没有什么监控数据,只有prometheus本身的数据,我们看下这些prometheus本身数据图表是怎样的。
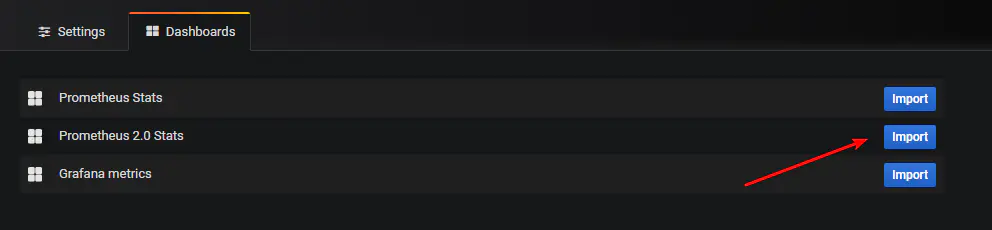
在添加数据源的位置上,右边的选项有个Dashboards的菜单选项,我们点击进去,然后导入prometheus2.0.
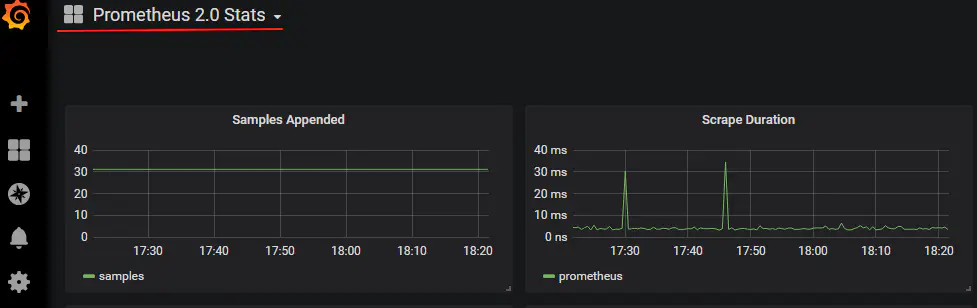
最后我们在左上角的位置上选择这个图表查看下,是不是很酷炫呢。这是个简单的示例,后续我们使用node-exporter来收集主机的性能信息,然后在grafana中展示。
四、 使用Node Exporter采集主机运行数据
与传统的监控zabbix来对比的话,prometheus-server就像是mysql,负责存储数据。只不过这是时序数据库而不是关系型的数据库。数据的收集还需要其他的客户端,在prometheus中叫做exporter。针对不同的服务,有各种各样的exporter,就好比zabbix的zabbix-agent一样。
这里为了能够采集到主机的运行指标如CPU, 内存,磁盘等信息。我们可以使用Node Exporter。Node Exporter同样采用Golang编写,并且不存在任何的第三方依赖,只需要下载,解压即可运行。可以从https://prometheus.io/download/获取最新的node exporter版本的二进制包。
4.1 下载node exporter
wget https://github.com/prometheus/node_exporter/releases/download/v0.18.1/node_exporter-0.18.1.linux-amd64.tar.gz
tar -xf node_exporter-0.18.1.linux-amd64.tar.gz
#新建一个目录专门安装各种exporter
mkdir -p /usr/local/prometheus_exporter
mv node_exporter-0.18.1.linux-amd64 /usr/local/prometheus_exporter/
cd /usr/local/prometheus_exporter/
ln -s node_exporter-0.18.1.linux-amd64/ node_exporter
4.2 启动node exporter
直接打开node_exporter的可执行文件即可启动 node export,默认会启动9100端口。建议使用nohup来启动
/usr/local/prometheus_exporter/node_exporter/node_exporter
#建议使用nohup
nohup /usr/local/prometheus_exporter/node_exporter/node_exporter >/dev/null 2>&1 &
4.3 加入开机启动
在 /etc/rc.local 加入上面的启动命令即可
##node exporter
nohup /usr/local/prometheus_exporter/node_exporter/node_exporter >/dev/null 2>&1 &
4.4 配置Prometheus,收集node exporter的数据
可以看到node exporter启动后也就是暴露了9100端口,并没有把数据传到prometheus,我们还需要在prometheus中配置,让prometheus去pull这个接口的数据。
编辑prometheus.yml文件,增加后面4行.
scrape_configs:
  - job_name: 'prometheus'
    static_configs:
    - targets: ['localhost:9090']

   #采集node exporter监控数据
  - job_name: 'node'
    static_configs:
    - targets: ['localhost:9100']
然后重启prometheus,打开prometheus页面查看是不是有对应的数据了。
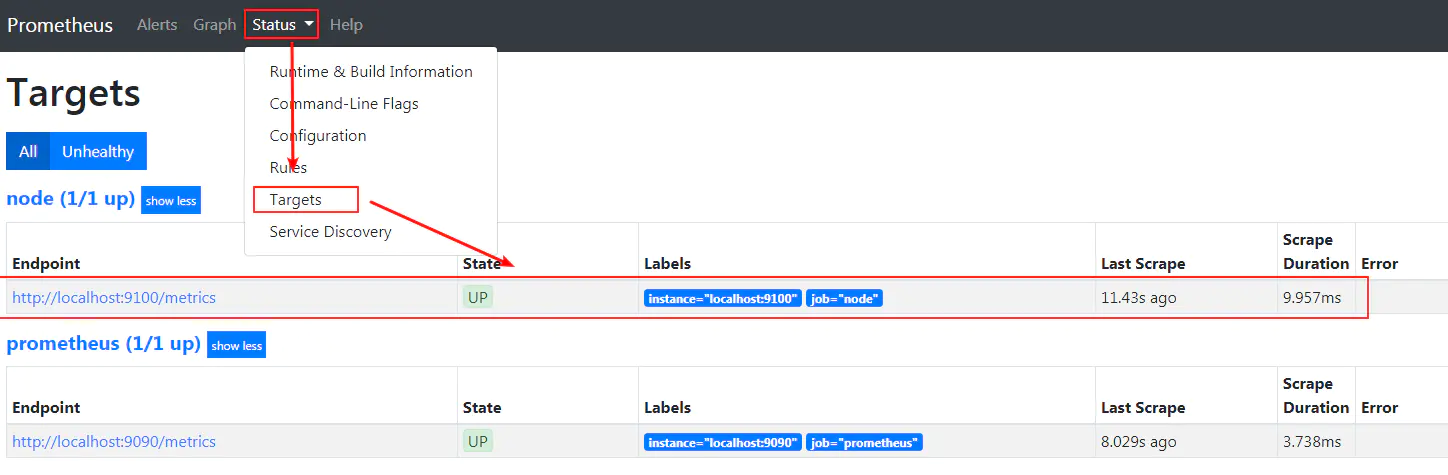
在prometheus的web界面看到这个节点是up的状态了,接下来我们在grafana中添加对应的模板。
4.5 导入grafana模板,数据展示
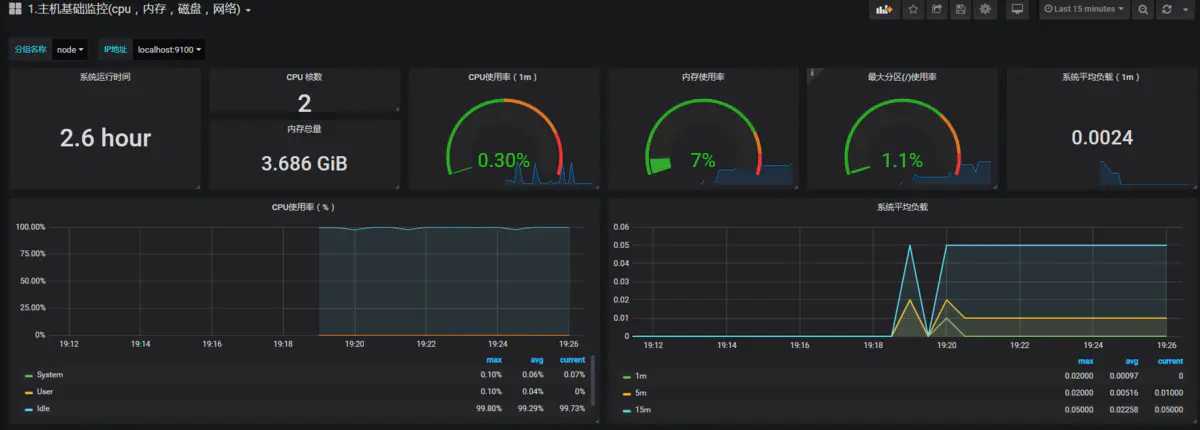
在导入界面,我们输入模板的编号,这里我使用的是9276号模板,如要使用其他的模板,请到grafana的官网去查找 https://grafana.com/grafana/dashboards
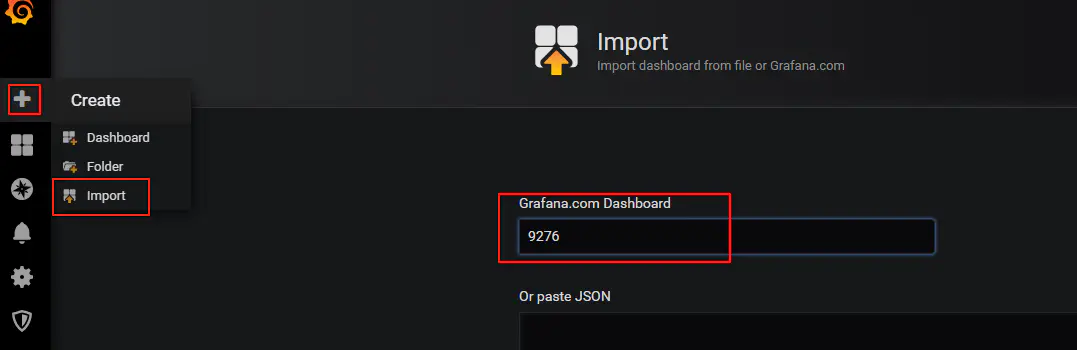
选择数据源,然后点击导入
然后你就可以看到下面一个这么形象具体好看的界面了。

 浙公网安备 33010602011771号