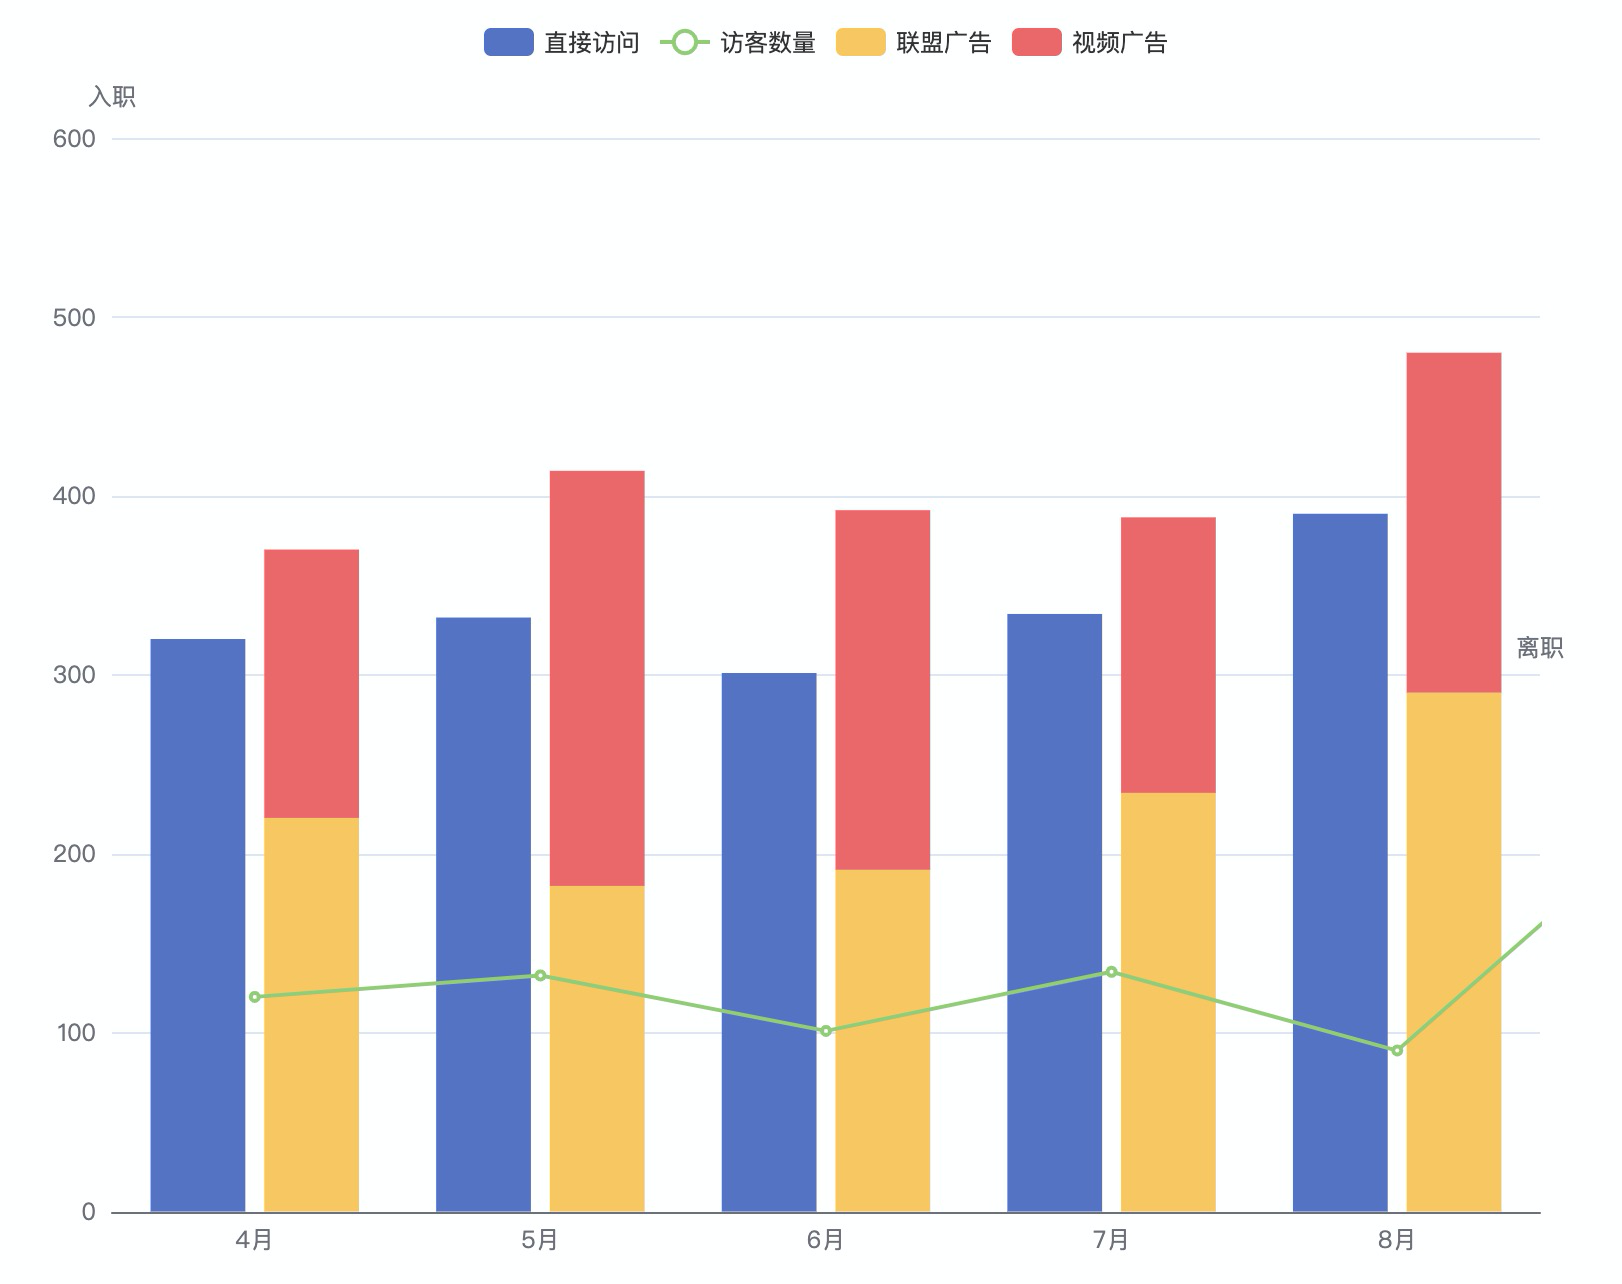
Echarts 实现双Y轴柱图、堆积图、折线图混合图
效果:

option配置:
option = {
    tooltip: {
        trigger: 'axis',
        axisPointer: {
            type: 'shadow',
            crossStyle: {
                color: '#999'
            }
        }
    },
    legend: {
        data: ['苹果', '华为', '小米', 'OPPO', 'VIVO']
    },
    xAxis: [
        {
            type: 'category',
            data: ['4月','5月','6月','7月','8月'],
            axisPointer: {
                type: 'shadow'
            }
        }
    ],
    yAxis: [
        {
            type: 'value',
            name: '水量',
            interval: 50,
            axisLabel: {
                formatter: '{value} ml'
            },
            axisLine: {
                show: false,
            },
            splitLine: {
                show: false,
            }
        },
        {
            type: 'value',
            name: '温度',
            interval: 5,
            axisLabel: {
                formatter: '{value} °C'
            },
            axisLine: {
                show: false,
            },
            splitLine: {
                show: false,
            }
        }
    ],
    series: [
        {
            name: '苹果',
            type: 'bar',
            data: [135.6, 162.2, 32.6, 20.0, 6.4]
        },
        {
            name: '华为',
            type: 'line',
            yAxisIndex: 1,
            data: [2.0, 2.2, 3.3, 4.5, 6.3]
        },
        {
            name: '小米',
            type: 'bar',
            stack: '广告',
            xAxisIndex: 0,
            yAxisIndex: 0,
            emphasis: {
                focus: 'series'
            },
            data: [13, 23, 19, 44, 135.6]
        },
        {
            name: 'OPPO',
            type: 'bar',
            stack: '广告',
            xAxisIndex: 0,
            yAxisIndex: 0,
            emphasis: {
                focus: 'series'
            },
            data: [21, 20, 61, 42, 22]
        },
        {
            name: 'VIVO',
            type: 'bar',
            stack: '广告',
            xAxisIndex: 0,
            yAxisIndex: 0,
            emphasis: {
                focus: 'series'
            },
            data: [19, 26, 42, 14, 31]
        }
    ]
};

