

python实现图像直方图
目录:
(一)直方图的使用
正文:
(一)直方图的使用
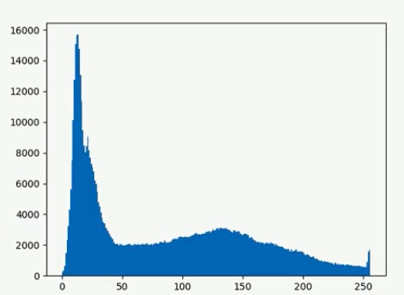
 1 from matplotlib import pyplot as plt
 2 def plot_demo(image):
 3     print(image.ravel())
 4     plt.hist(image.ravel(),256,[0,256]) #ravel将图像3维转一维数组,便于统计频率
 5     # 统计为256个bin,显示0-255bin,意思是全部显示,我们可以设置只显示一部分
 6     plt.show()
 7  8 src = cv.imread("./1.png")  #读取图片
 9 cv.namedWindow("input image",cv.WINDOW_AUTOSIZE)    #创建GUI窗口,形式为自适应
10 cv.imshow("input image",src)    #通过名字将图像和窗口联系
11 image_hist(src)
12 cv.waitKey(0)   #等待用户操作,里面等待参数是毫秒,我们填写0,代表是永远,等待用户操作
13 cv.destroyAllWindows()  #销毁所有窗口
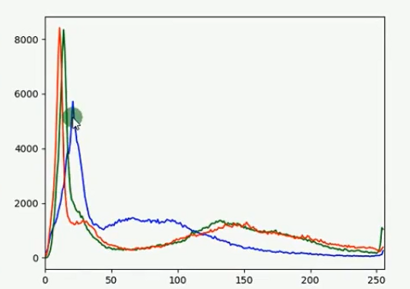
1 def image_hist(image):
2     color = ("blue","green","red")
3     for i,color in enumerate(color):
4         hist = cv.calcHist([image],[i],None,[256],[0,256])
5         plt.plot(hist,color=color)  #传入直方图数据,设置显示颜色
6         plt.xlim([0,256])   #设定图标的上下限,默认是全选,可不用设置
7     plt.show()
1.def calcHist(images, channels, mask, histSize, ranges, hist=None, accumulate=None): # real signature unknown; restored from __doc__
images:输入图像
channels:需要统计直方图的第几通道
mask:掩膜,,计算掩膜内的直方图 ...Mat()
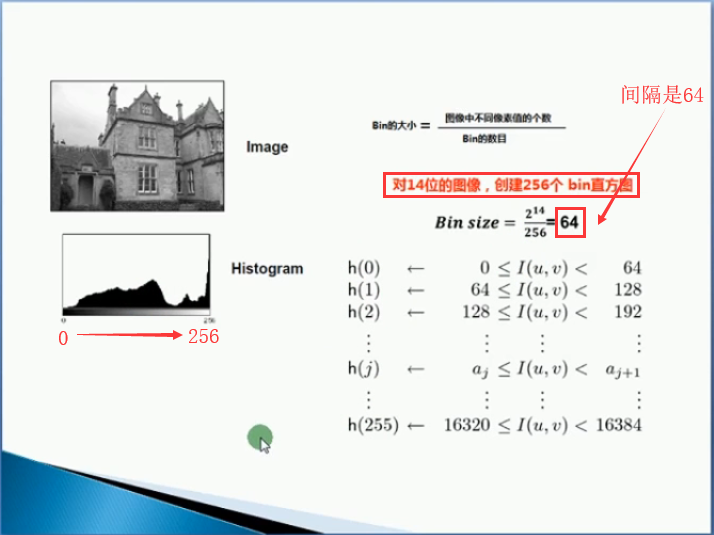
histSize:指的是直方图分成多少个区间,就是 bin的个数
ranges: 统计像素值得区间
hist:输出的直方图数组
accumulate=false:在多个图像时,是否累计计算像素值得个数
参考:
https://www.cnblogs.com/ssyfj/p/9270333.html

