
Yolov8-源码解析-三-
Yolov8 源码解析(三)
comments: true
description: Explore the SKU-110k dataset of densely packed retail shelf images, perfect for training and evaluating deep learning models in object detection tasks.
keywords: SKU-110k, dataset, object detection, retail shelf images, deep learning, computer vision, model training
SKU-110k Dataset
The SKU-110k dataset is a collection of densely packed retail shelf images, designed to support research in object detection tasks. Developed by Eran Goldman et al., the dataset contains over 110,000 unique store keeping unit (SKU) categories with densely packed objects, often looking similar or even identical, positioned in close proximity.
Watch: How to Train YOLOv10 on SKU-110k Dataset using Ultralytics | Retail Dataset

Key Features
- SKU-110k contains images of store shelves from around the world, featuring densely packed objects that pose challenges for state-of-the-art object detectors.
- The dataset includes over 110,000 unique SKU categories, providing a diverse range of object appearances.
- Annotations include bounding boxes for objects and SKU category labels.
Dataset Structure
The SKU-110k dataset is organized into three main subsets:
- Training set: This subset contains images and annotations used for training object detection models.
- Validation set: This subset consists of images and annotations used for model validation during training.
- Test set: This subset is designed for the final evaluation of trained object detection models.
Applications
The SKU-110k dataset is widely used for training and evaluating deep learning models in object detection tasks, especially in densely packed scenes such as retail shelf displays. The dataset's diverse set of SKU categories and densely packed object arrangements make it a valuable resource for researchers and practitioners in the field of computer vision.
Dataset YAML
A YAML (Yet Another Markup Language) file is used to define the dataset configuration. It contains information about the dataset's paths, classes, and other relevant information. For the case of the SKU-110K dataset, the SKU-110K.yaml file is maintained at https://github.com/ultralytics/ultralytics/blob/main/ultralytics/cfg/datasets/SKU-110K.yaml.
!!! Example "ultralytics/cfg/datasets/SKU-110K.yaml"
```py
--8<-- "ultralytics/cfg/datasets/SKU-110K.yaml"
```
Usage
To train a YOLOv8n model on the SKU-110K dataset for 100 epochs with an image size of 640, you can use the following code snippets. For a comprehensive list of available arguments, refer to the model Training page.
!!! Example "Train Example"
=== "Python"

    ```py
    from ultralytics import YOLO

    # Load a model
    model = YOLO("yolov8n.pt")  # load a pretrained model (recommended for training)

    # Train the model
    results = model.train(data="SKU-110K.yaml", epochs=100, imgsz=640)
    ```

=== "CLI"

    ```py
    # Start training from a pretrained *.pt model
    yolo detect train data=SKU-110K.yaml model=yolov8n.pt epochs=100 imgsz=640
    ```
Sample Data and Annotations
The SKU-110k dataset contains a diverse set of retail shelf images with densely packed objects, providing rich context for object detection tasks. Here are some examples of data from the dataset, along with their corresponding annotations:

- Densely packed retail shelf image: This image demonstrates an example of densely packed objects in a retail shelf setting. Objects are annotated with bounding boxes and SKU category labels.
The example showcases the variety and complexity of the data in the SKU-110k dataset and highlights the importance of high-quality data for object detection tasks.
Citations and Acknowledgments
If you use the SKU-110k dataset in your research or development work, please cite the following paper:
!!! Quote ""
=== "BibTeX"

    ```py
    @inproceedings{goldman2019dense,
     author    = {Eran Goldman and Roei Herzig and Aviv Eisenschtat and Jacob Goldberger and Tal Hassner},
     title     = {Precise Detection in Densely Packed Scenes},
     booktitle = {Proc. Conf. Comput. Vision Pattern Recognition (CVPR)},
     year      = {2019}
    }
    ```
We would like to acknowledge Eran Goldman et al. for creating and maintaining the SKU-110k dataset as a valuable resource for the computer vision research community. For more information about the SKU-110k dataset and its creators, visit the SKU-110k dataset GitHub repository.
FAQ
What is the SKU-110k dataset and why is it important for object detection?
The SKU-110k dataset consists of densely packed retail shelf images designed to aid research in object detection tasks. Developed by Eran Goldman et al., it includes over 110,000 unique SKU categories. Its importance lies in its ability to challenge state-of-the-art object detectors with diverse object appearances and close proximity, making it an invaluable resource for researchers and practitioners in computer vision. Learn more about the dataset's structure and applications in our SKU-110k Dataset section.
How do I train a YOLOv8 model using the SKU-110k dataset?
Training a YOLOv8 model on the SKU-110k dataset is straightforward. Here's an example to train a YOLOv8n model for 100 epochs with an image size of 640:
!!! Example "Train Example"
=== "Python"

    ```py
    from ultralytics import YOLO

    # Load a model
    model = YOLO("yolov8n.pt")  # load a pretrained model (recommended for training)

    # Train the model
    results = model.train(data="SKU-110K.yaml", epochs=100, imgsz=640)
    ```


=== "CLI"

    ```py
    # Start training from a pretrained *.pt model
    yolo detect train data=SKU-110K.yaml model=yolov8n.pt epochs=100 imgsz=640
    ```
For a comprehensive list of available arguments, refer to the model Training page.
What are the main subsets of the SKU-110k dataset?
The SKU-110k dataset is organized into three main subsets:
- Training set: Contains images and annotations used for training object detection models.
- Validation set: Consists of images and annotations used for model validation during training.
- Test set: Designed for the final evaluation of trained object detection models.
Refer to the Dataset Structure section for more details.
How do I configure the SKU-110k dataset for training?
The SKU-110k dataset configuration is defined in a YAML file, which includes details about the dataset's paths, classes, and other relevant information. The SKU-110K.yaml file is maintained at SKU-110K.yaml. For example, you can train a model using this configuration as shown in our Usage section.
What are the key features of the SKU-110k dataset in the context of deep learning?
The SKU-110k dataset features images of store shelves from around the world, showcasing densely packed objects that pose significant challenges for object detectors:
- Over 110,000 unique SKU categories
- Diverse object appearances
- Annotations include bounding boxes and SKU category labels
These features make the SKU-110k dataset particularly valuable for training and evaluating deep learning models in object detection tasks. For more details, see the Key Features section.
How do I cite the SKU-110k dataset in my research?
If you use the SKU-110k dataset in your research or development work, please cite the following paper:
!!! Quote ""
=== "BibTeX"

    ```py
    @inproceedings{goldman2019dense,
     author    = {Eran Goldman and Roei Herzig and Aviv Eisenschtat and Jacob Goldberger and Tal Hassner},
     title     = {Precise Detection in Densely Packed Scenes},
     booktitle = {Proc. Conf. Comput. Vision Pattern Recognition (CVPR)},
     year      = {2019}
    }
    ```
More information about the dataset can be found in the Citations and Acknowledgments section.
comments: true
description: Explore the VisDrone Dataset, a large-scale benchmark for drone-based image and video analysis with over 2.6 million annotations for objects like pedestrians and vehicles.
keywords: VisDrone, drone dataset, computer vision, object detection, object tracking, crowd counting, machine learning, deep learning
VisDrone Dataset
The VisDrone Dataset is a large-scale benchmark created by the AISKYEYE team at the Lab of Machine Learning and Data Mining, Tianjin University, China. It contains carefully annotated ground truth data for various computer vision tasks related to drone-based image and video analysis.
VisDrone is composed of 288 video clips with 261,908 frames and 10,209 static images, captured by various drone-mounted cameras. The dataset covers a wide range of aspects, including location (14 different cities across China), environment (urban and rural), objects (pedestrians, vehicles, bicycles, etc.), and density (sparse and crowded scenes). The dataset was collected using various drone platforms under different scenarios and weather and lighting conditions. These frames are manually annotated with over 2.6 million bounding boxes of targets such as pedestrians, cars, bicycles, and tricycles. Attributes like scene visibility, object class, and occlusion are also provided for better data utilization.
Dataset Structure
The VisDrone dataset is organized into five main subsets, each focusing on a specific task:
- Task 1: Object detection in images
- Task 2: Object detection in videos
- Task 3: Single-object tracking
- Task 4: Multi-object tracking
- Task 5: Crowd counting
Applications
The VisDrone dataset is widely used for training and evaluating deep learning models in drone-based computer vision tasks such as object detection, object tracking, and crowd counting. The dataset's diverse set of sensor data, object annotations, and attributes make it a valuable resource for researchers and practitioners in the field of drone-based computer vision.
Dataset YAML
A YAML (Yet Another Markup Language) file is used to define the dataset configuration. It contains information about the dataset's paths, classes, and other relevant information. In the case of the Visdrone dataset, the VisDrone.yaml file is maintained at https://github.com/ultralytics/ultralytics/blob/main/ultralytics/cfg/datasets/VisDrone.yaml.
!!! Example "ultralytics/cfg/datasets/VisDrone.yaml"
```py
--8<-- "ultralytics/cfg/datasets/VisDrone.yaml"
```
Usage
To train a YOLOv8n model on the VisDrone dataset for 100 epochs with an image size of 640, you can use the following code snippets. For a comprehensive list of available arguments, refer to the model Training page.
!!! Example "Train Example"
=== "Python"

    ```py
    from ultralytics import YOLO

    # Load a model
    model = YOLO("yolov8n.pt")  # load a pretrained model (recommended for training)

    # Train the model
    results = model.train(data="VisDrone.yaml", epochs=100, imgsz=640)
    ```

=== "CLI"

    ```py
    # Start training from a pretrained *.pt model
    yolo detect train data=VisDrone.yaml model=yolov8n.pt epochs=100 imgsz=640
    ```
Sample Data and Annotations
The VisDrone dataset contains a diverse set of images and videos captured by drone-mounted cameras. Here are some examples of data from the dataset, along with their corresponding annotations:
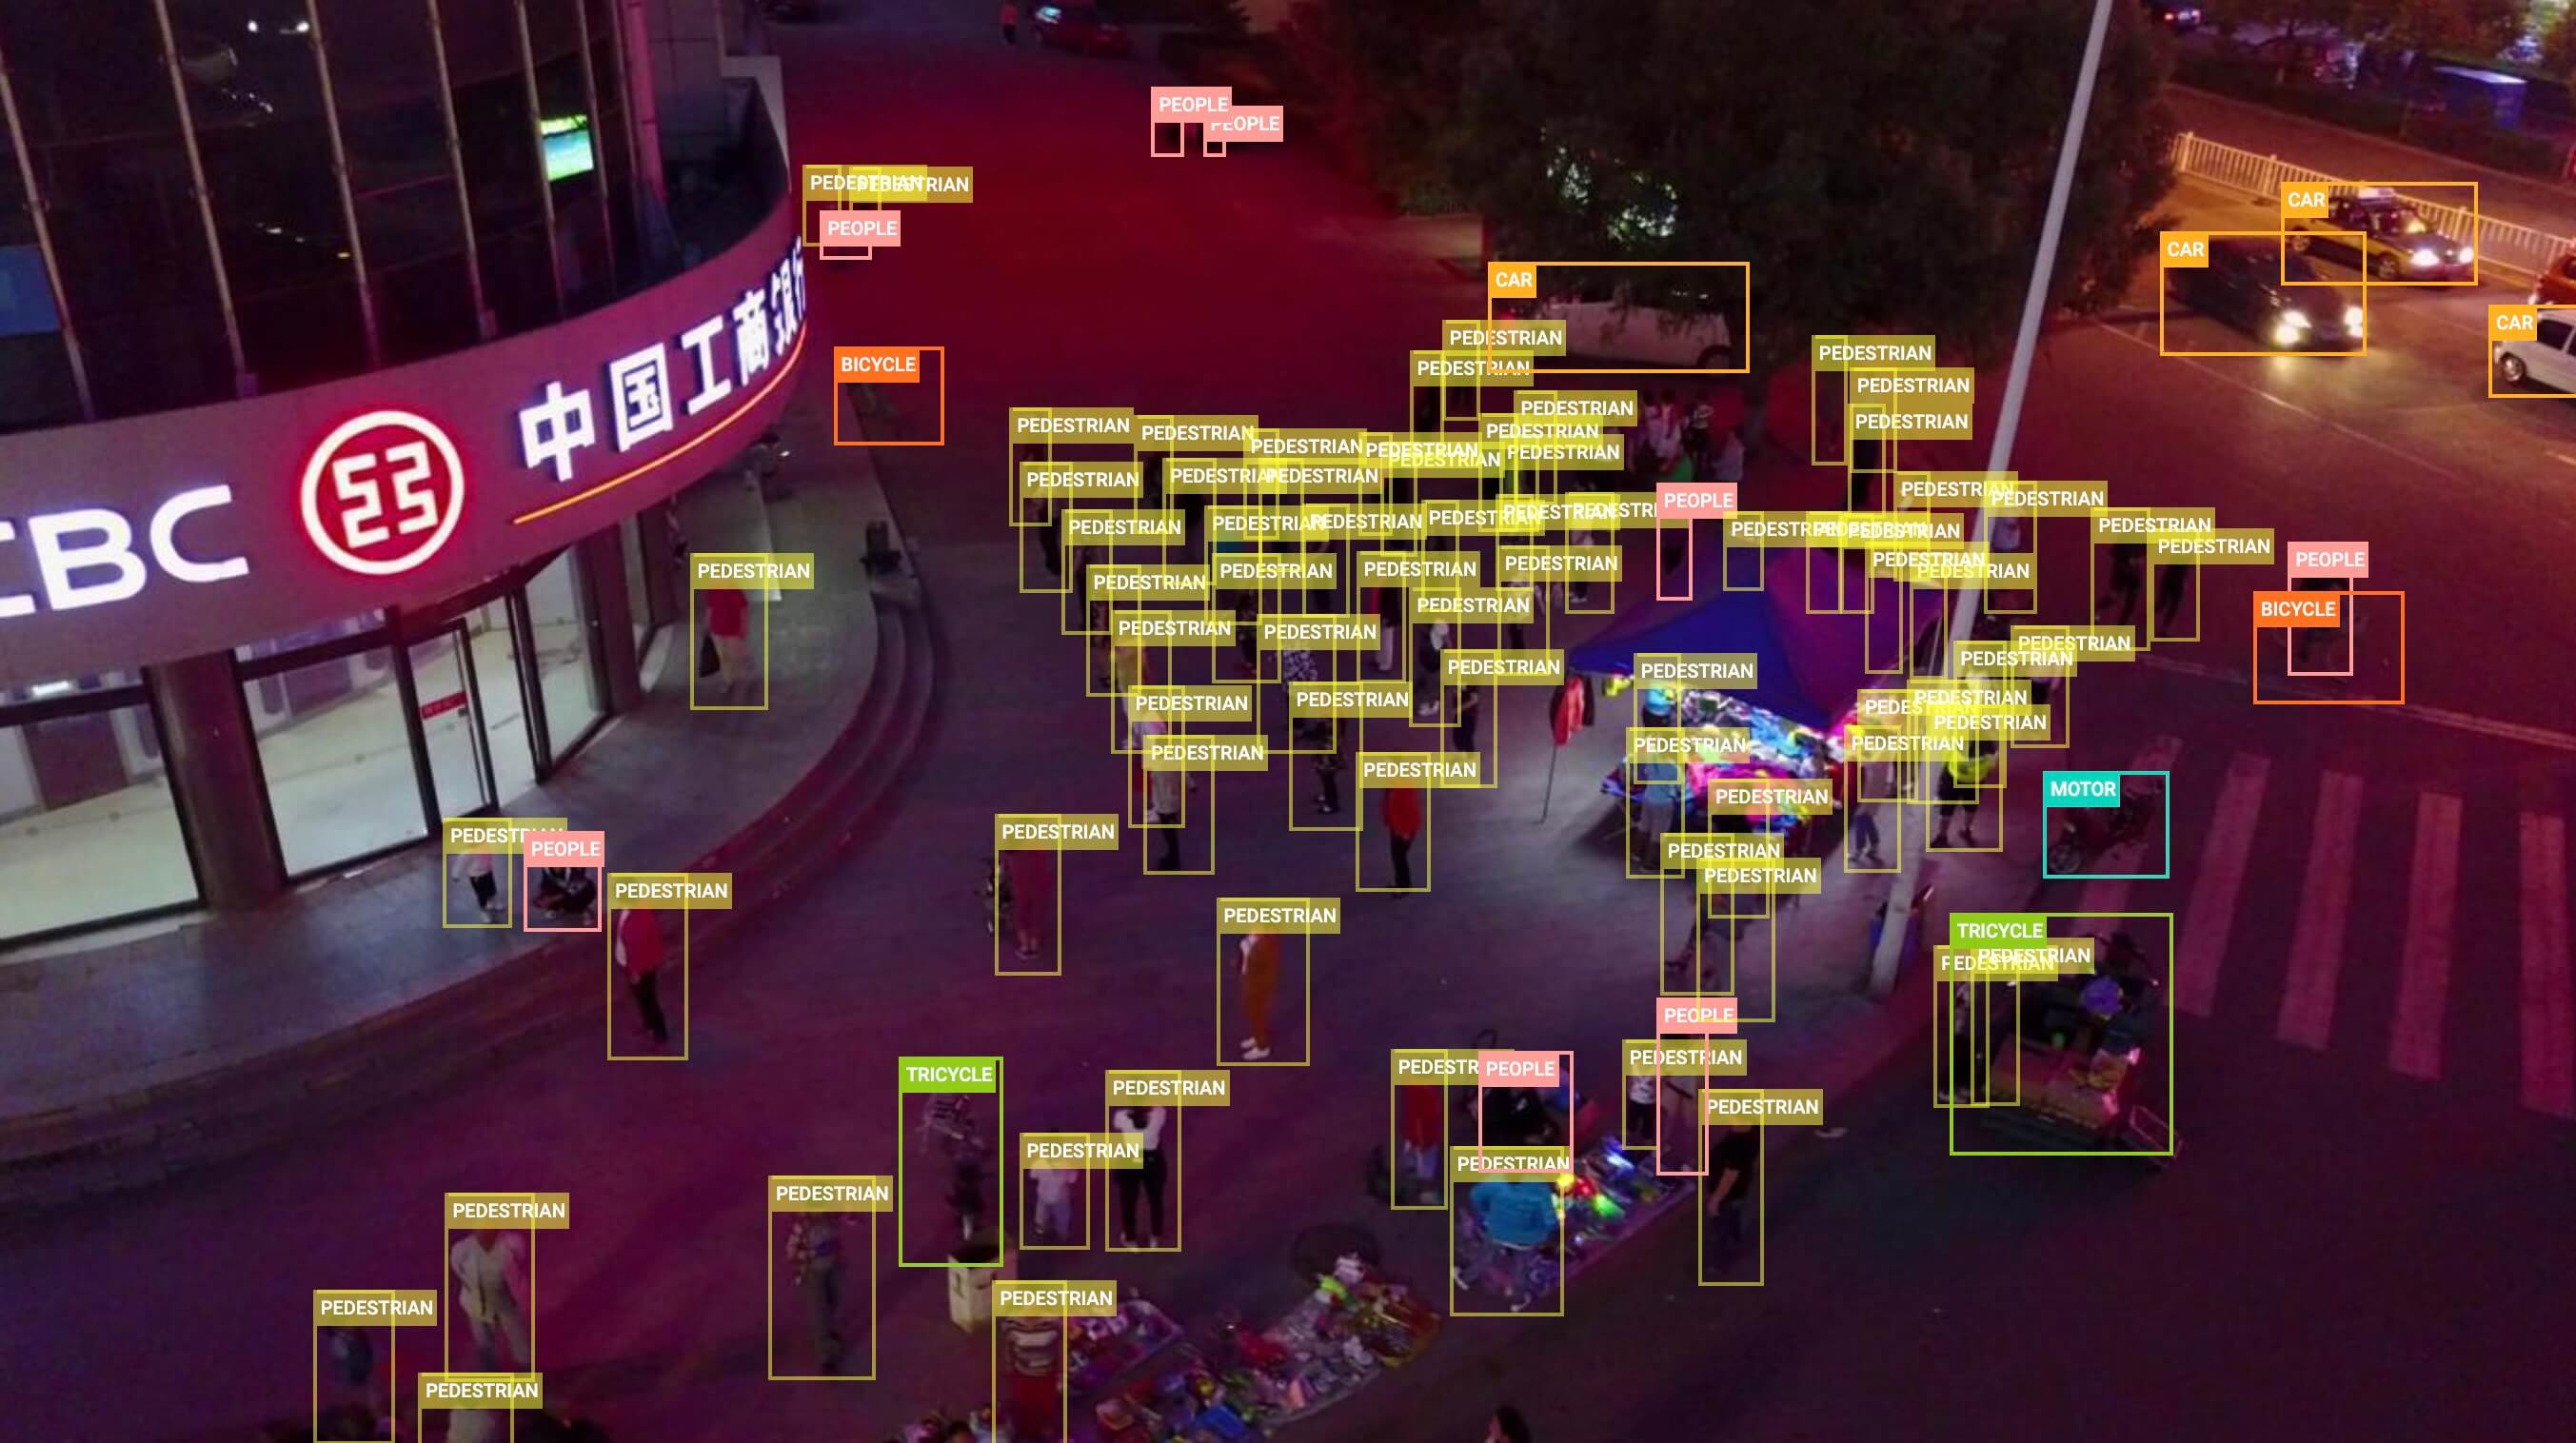
- Task 1: Object detection in images - This image demonstrates an example of object detection in images, where objects are annotated with bounding boxes. The dataset provides a wide variety of images taken from different locations, environments, and densities to facilitate the development of models for this task.
The example showcases the variety and complexity of the data in the VisDrone dataset and highlights the importance of high-quality sensor data for drone-based computer vision tasks.
Citations and Acknowledgments
If you use the VisDrone dataset in your research or development work, please cite the following paper:
!!! Quote ""
=== "BibTeX"

    ```py
    @ARTICLE{9573394,
      author={Zhu, Pengfei and Wen, Longyin and Du, Dawei and Bian, Xiao and Fan, Heng and Hu, Qinghua and Ling, Haibin},
      journal={IEEE Transactions on Pattern Analysis and Machine Intelligence},
      title={Detection and Tracking Meet Drones Challenge},
      year={2021},
      volume={},
      number={},
      pages={1-1},
      doi={10.1109/TPAMI.2021.3119563}}
    ```
We would like to acknowledge the AISKYEYE team at the Lab of Machine Learning and Data Mining, Tianjin University, China, for creating and maintaining the VisDrone dataset as a valuable resource for the drone-based computer vision research community. For more information about the VisDrone dataset and its creators, visit the VisDrone Dataset GitHub repository.
FAQ
What is the VisDrone Dataset and what are its key features?
The VisDrone Dataset is a large-scale benchmark created by the AISKYEYE team at Tianjin University, China. It is designed for various computer vision tasks related to drone-based image and video analysis. Key features include:
- Composition: 288 video clips with 261,908 frames and 10,209 static images.
- Annotations: Over 2.6 million bounding boxes for objects like pedestrians, cars, bicycles, and tricycles.
- Diversity: Collected across 14 cities, in urban and rural settings, under different weather and lighting conditions.
- Tasks: Split into five main tasks—object detection in images and videos, single-object and multi-object tracking, and crowd counting.
How can I use the VisDrone Dataset to train a YOLOv8 model with Ultralytics?
To train a YOLOv8 model on the VisDrone dataset for 100 epochs with an image size of 640, you can follow these steps:
!!! Example "Train Example"
=== "Python"

    ```py
    from ultralytics import YOLO

    # Load a pretrained model
    model = YOLO("yolov8n.pt")

    # Train the model
    results = model.train(data="VisDrone.yaml", epochs=100, imgsz=640)
    ```

=== "CLI"

    ```py
    # Start training from a pretrained *.pt model
    yolo detect train data=VisDrone.yaml model=yolov8n.pt epochs=100 imgsz=640
    ```
For additional configuration options, please refer to the model Training page.
What are the main subsets of the VisDrone dataset and their applications?
The VisDrone dataset is divided into five main subsets, each tailored for a specific computer vision task:
- Task 1: Object detection in images.
- Task 2: Object detection in videos.
- Task 3: Single-object tracking.
- Task 4: Multi-object tracking.
- Task 5: Crowd counting.
These subsets are widely used for training and evaluating deep learning models in drone-based applications such as surveillance, traffic monitoring, and public safety.
Where can I find the configuration file for the VisDrone dataset in Ultralytics?
The configuration file for the VisDrone dataset, VisDrone.yaml, can be found in the Ultralytics repository at the following link:
VisDrone.yaml.
How can I cite the VisDrone dataset if I use it in my research?
If you use the VisDrone dataset in your research or development work, please cite the following paper:
!!! Quote "BibTeX"
```py
@ARTICLE{9573394,
  author={Zhu, Pengfei and Wen, Longyin and Du, Dawei and Bian, Xiao and Fan, Heng and Hu, Qinghua and Ling, Haibin},
  journal={IEEE Transactions on Pattern Analysis and Machine Intelligence},
  title={Detection and Tracking Meet Drones Challenge},
  year={2021},
  volume={},
  number={},
  pages={1-1},
  doi={10.1109/TPAMI.2021.3119563}}
```
comments: true
description: Discover the PASCAL VOC dataset, essential for object detection, segmentation, and classification. Learn key features, applications, and usage tips.
keywords: PASCAL VOC, VOC dataset, object detection, segmentation, classification, YOLO, Faster R-CNN, Mask R-CNN, image annotations, computer vision
VOC Dataset
The PASCAL VOC (Visual Object Classes) dataset is a well-known object detection, segmentation, and classification dataset. It is designed to encourage research on a wide variety of object categories and is commonly used for benchmarking computer vision models. It is an essential dataset for researchers and developers working on object detection, segmentation, and classification tasks.
Key Features
- VOC dataset includes two main challenges: VOC2007 and VOC2012.
- The dataset comprises 20 object categories, including common objects like cars, bicycles, and animals, as well as more specific categories such as boats, sofas, and dining tables.
- Annotations include object bounding boxes and class labels for object detection and classification tasks, and segmentation masks for the segmentation tasks.
- VOC provides standardized evaluation metrics like mean Average Precision (mAP) for object detection and classification, making it suitable for comparing model performance.
Dataset Structure
The VOC dataset is split into three subsets:
- Train: This subset contains images for training object detection, segmentation, and classification models.
- Validation: This subset has images used for validation purposes during model training.
- Test: This subset consists of images used for testing and benchmarking the trained models. Ground truth annotations for this subset are not publicly available, and the results are submitted to the PASCAL VOC evaluation server for performance evaluation.
Applications
The VOC dataset is widely used for training and evaluating deep learning models in object detection (such as YOLO, Faster R-CNN, and SSD), instance segmentation (such as Mask R-CNN), and image classification. The dataset's diverse set of object categories, large number of annotated images, and standardized evaluation metrics make it an essential resource for computer vision researchers and practitioners.
Dataset YAML
A YAML (Yet Another Markup Language) file is used to define the dataset configuration. It contains information about the dataset's paths, classes, and other relevant information. In the case of the VOC dataset, the VOC.yaml file is maintained at https://github.com/ultralytics/ultralytics/blob/main/ultralytics/cfg/datasets/VOC.yaml.
!!! Example "ultralytics/cfg/datasets/VOC.yaml"
```py
--8<-- "ultralytics/cfg/datasets/VOC.yaml"
```
Usage
To train a YOLOv8n model on the VOC dataset for 100 epochs with an image size of 640, you can use the following code snippets. For a comprehensive list of available arguments, refer to the model Training page.
!!! Example "Train Example"
=== "Python"

    ```py
    from ultralytics import YOLO

    # Load a model
    model = YOLO("yolov8n.pt")  # load a pretrained model (recommended for training)

    # Train the model
    results = model.train(data="VOC.yaml", epochs=100, imgsz=640)
    ```

=== "CLI"

    ```py
    # Start training from a pretrained *.pt model
    yolo detect train data=VOC.yaml model=yolov8n.pt epochs=100 imgsz=640
    ```
Sample Images and Annotations
The VOC dataset contains a diverse set of images with various object categories and complex scenes. Here are some examples of images from the dataset, along with their corresponding annotations:
- Mosaiced Image: This image demonstrates a training batch composed of mosaiced dataset images. Mosaicing is a technique used during training that combines multiple images into a single image to increase the variety of objects and scenes within each training batch. This helps improve the model's ability to generalize to different object sizes, aspect ratios, and contexts.
The example showcases the variety and complexity of the images in the VOC dataset and the benefits of using mosaicing during the training process.
Citations and Acknowledgments
If you use the VOC dataset in your research or development work, please cite the following paper:
!!! Quote ""
=== "BibTeX"

    ```py
    @misc{everingham2010pascal,
          title={The PASCAL Visual Object Classes (VOC) Challenge},
          author={Mark Everingham and Luc Van Gool and Christopher K. I. Williams and John Winn and Andrew Zisserman},
          year={2010},
          eprint={0909.5206},
          archivePrefix={arXiv},
          primaryClass={cs.CV}
    }
    ```
We would like to acknowledge the PASCAL VOC Consortium for creating and maintaining this valuable resource for the computer vision community. For more information about the VOC dataset and its creators, visit the PASCAL VOC dataset website.
FAQ
What is the PASCAL VOC dataset and why is it important for computer vision tasks?
The PASCAL VOC (Visual Object Classes) dataset is a renowned benchmark for object detection, segmentation, and classification in computer vision. It includes comprehensive annotations like bounding boxes, class labels, and segmentation masks across 20 different object categories. Researchers use it widely to evaluate the performance of models like Faster R-CNN, YOLO, and Mask R-CNN due to its standardized evaluation metrics such as mean Average Precision (mAP).
How do I train a YOLOv8 model using the VOC dataset?
To train a YOLOv8 model with the VOC dataset, you need the dataset configuration in a YAML file. Here's an example to start training a YOLOv8n model for 100 epochs with an image size of 640:
!!! Example "Train Example"
=== "Python"

    ```py
    from ultralytics import YOLO

    # Load a model
    model = YOLO("yolov8n.pt")  # load a pretrained model (recommended for training)

    # Train the model
    results = model.train(data="VOC.yaml", epochs=100, imgsz=640)
    ```

=== "CLI"

    ```py
    # Start training from a pretrained *.pt model
    yolo detect train data=VOC.yaml model=yolov8n.pt epochs=100 imgsz=640
    ```
What are the primary challenges included in the VOC dataset?
The VOC dataset includes two main challenges: VOC2007 and VOC2012. These challenges test object detection, segmentation, and classification across 20 diverse object categories. Each image is meticulously annotated with bounding boxes, class labels, and segmentation masks. The challenges provide standardized metrics like mAP, facilitating the comparison and benchmarking of different computer vision models.
How does the PASCAL VOC dataset enhance model benchmarking and evaluation?
The PASCAL VOC dataset enhances model benchmarking and evaluation through its detailed annotations and standardized metrics like mean Average Precision (mAP). These metrics are crucial for assessing the performance of object detection and classification models. The dataset's diverse and complex images ensure comprehensive model evaluation across various real-world scenarios.
How do I use the VOC dataset for semantic segmentation in YOLO models?
To use the VOC dataset for semantic segmentation tasks with YOLO models, you need to configure the dataset properly in a YAML file. The YAML file defines paths and classes needed for training segmentation models. Check the VOC dataset YAML configuration file at VOC.yaml for detailed setups.
comments: true
description: Explore the xView dataset, a rich resource of 1M+ object instances in high-resolution satellite imagery. Enhance detection, learning efficiency, and more.
keywords: xView dataset, overhead imagery, satellite images, object detection, high resolution, bounding boxes, computer vision, TensorFlow, PyTorch, dataset structure
xView Dataset
The xView dataset is one of the largest publicly available datasets of overhead imagery, containing images from complex scenes around the world annotated using bounding boxes. The goal of the xView dataset is to accelerate progress in four computer vision frontiers:
- Reduce minimum resolution for detection.
- Improve learning efficiency.
- Enable discovery of more object classes.
- Improve detection of fine-grained classes.
xView builds on the success of challenges like Common Objects in Context (COCO) and aims to leverage computer vision to analyze the growing amount of available imagery from space in order to understand the visual world in new ways and address a range of important applications.
Key Features
- xView contains over 1 million object instances across 60 classes.
- The dataset has a resolution of 0.3 meters, providing higher resolution imagery than most public satellite imagery datasets.
- xView features a diverse collection of small, rare, fine-grained, and multi-type objects with bounding box annotation.
- Comes with a pre-trained baseline model using the TensorFlow object detection API and an example for PyTorch.
Dataset Structure
The xView dataset is composed of satellite images collected from WorldView-3 satellites at a 0.3m ground sample distance. It contains over 1 million objects across 60 classes in over 1,400 km² of imagery.
Applications
The xView dataset is widely used for training and evaluating deep learning models for object detection in overhead imagery. The dataset's diverse set of object classes and high-resolution imagery make it a valuable resource for researchers and practitioners in the field of computer vision, especially for satellite imagery analysis.
Dataset YAML
A YAML (Yet Another Markup Language) file is used to define the dataset configuration. It contains information about the dataset's paths, classes, and other relevant information. In the case of the xView dataset, the xView.yaml file is maintained at https://github.com/ultralytics/ultralytics/blob/main/ultralytics/cfg/datasets/xView.yaml.
!!! Example "ultralytics/cfg/datasets/xView.yaml"
```py
--8<-- "ultralytics/cfg/datasets/xView.yaml"
```
Usage
To train a model on the xView dataset for 100 epochs with an image size of 640, you can use the following code snippets. For a comprehensive list of available arguments, refer to the model Training page.
!!! Example "Train Example"
=== "Python"

    ```py
    from ultralytics import YOLO

    # Load a model
    model = YOLO("yolov8n.pt")  # load a pretrained model (recommended for training)

    # Train the model
    results = model.train(data="xView.yaml", epochs=100, imgsz=640)
    ```

=== "CLI"

    ```py
    # Start training from a pretrained *.pt model
    yolo detect train data=xView.yaml model=yolov8n.pt epochs=100 imgsz=640
    ```
Sample Data and Annotations
The xView dataset contains high-resolution satellite images with a diverse set of objects annotated using bounding boxes. Here are some examples of data from the dataset, along with their corresponding annotations:

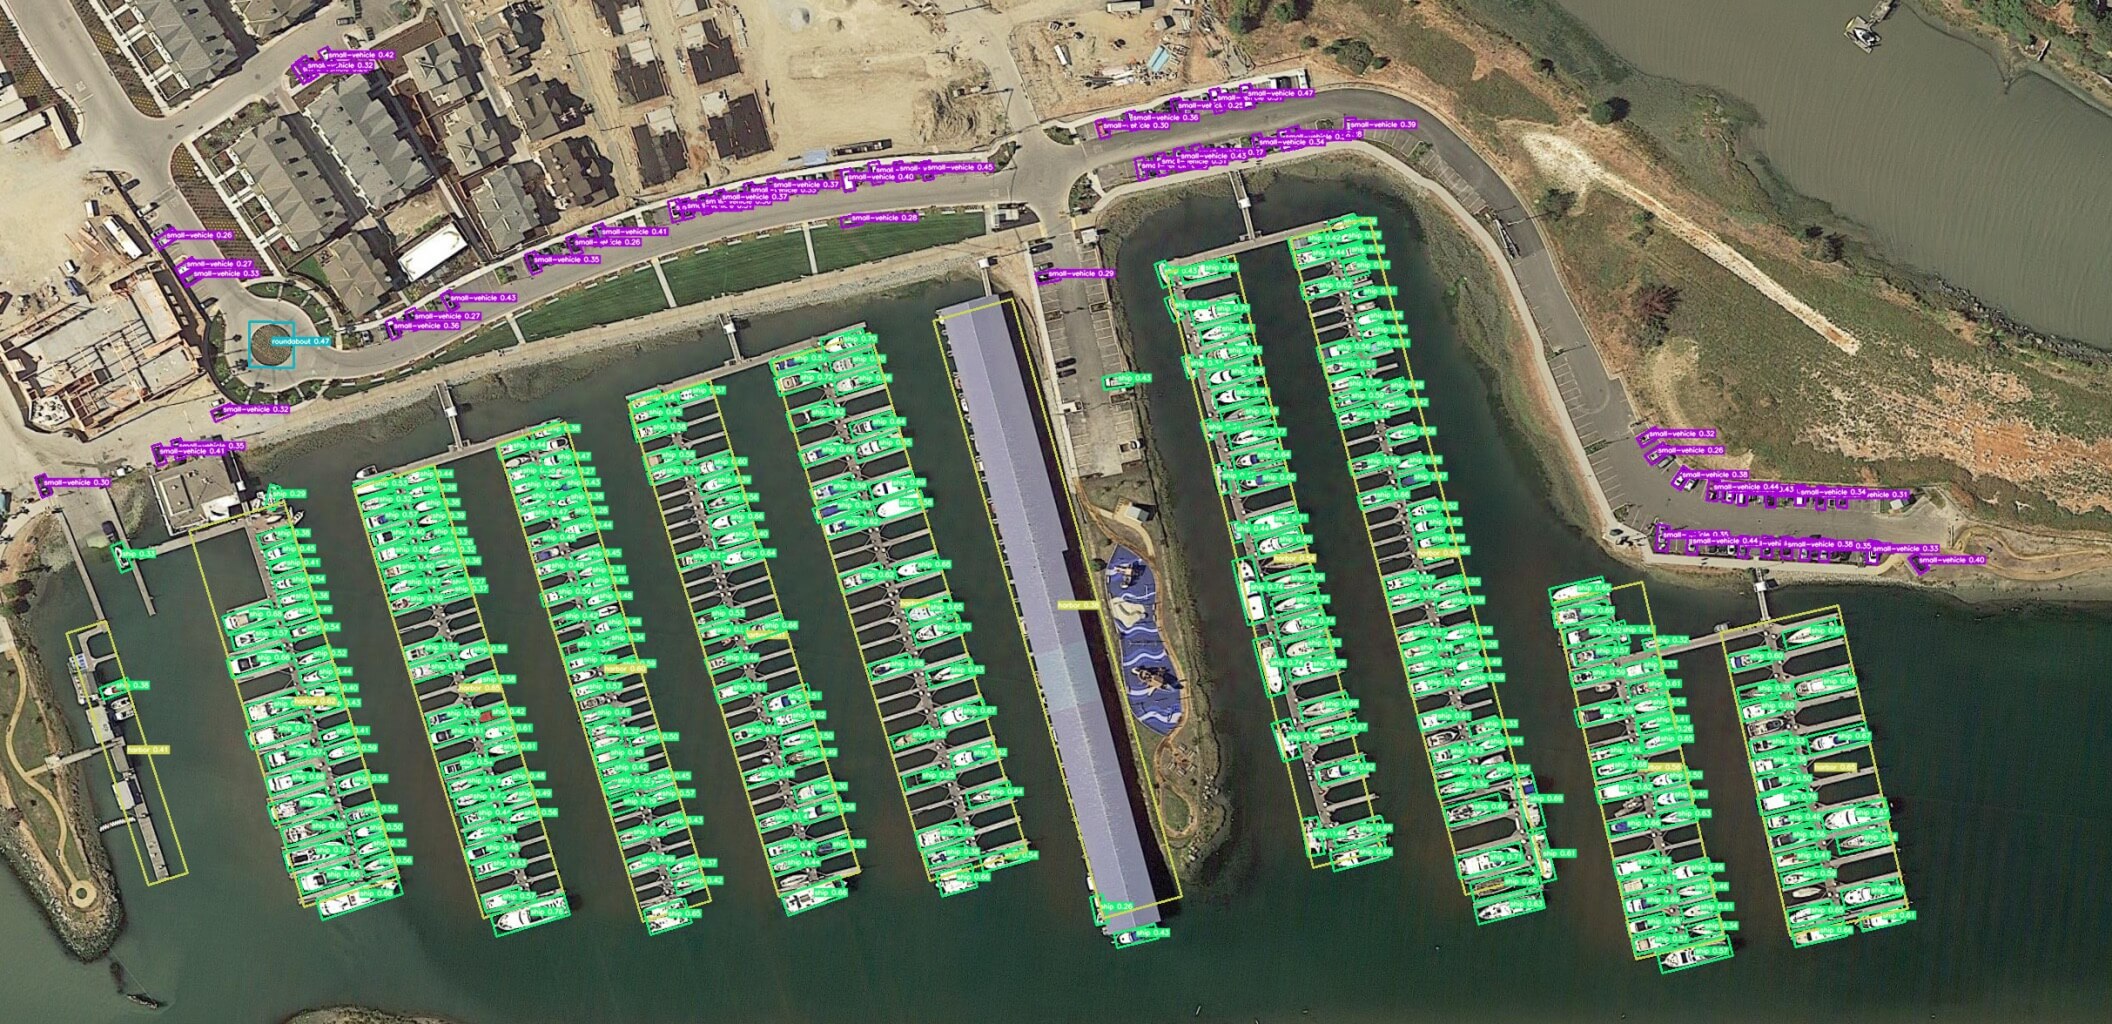
- Overhead Imagery: This image demonstrates an example of object detection in overhead imagery, where objects are annotated with bounding boxes. The dataset provides high-resolution satellite images to facilitate the development of models for this task.
The example showcases the variety and complexity of the data in the xView dataset and highlights the importance of high-quality satellite imagery for object detection tasks.
Citations and Acknowledgments
If you use the xView dataset in your research or development work, please cite the following paper:
!!! Quote ""
=== "BibTeX"

    ```py
    @misc{lam2018xview,
          title={xView: Objects in Context in Overhead Imagery},
          author={Darius Lam and Richard Kuzma and Kevin McGee and Samuel Dooley and Michael Laielli and Matthew Klaric and Yaroslav Bulatov and Brendan McCord},
          year={2018},
          eprint={1802.07856},
          archivePrefix={arXiv},
          primaryClass={cs.CV}
    }
    ```
We would like to acknowledge the Defense Innovation Unit (DIU) and the creators of the xView dataset for their valuable contribution to the computer vision research community. For more information about the xView dataset and its creators, visit the xView dataset website.
FAQ
What is the xView dataset and how does it benefit computer vision research?
The xView dataset is one of the largest publicly available collections of high-resolution overhead imagery, containing over 1 million object instances across 60 classes. It is designed to enhance various facets of computer vision research such as reducing the minimum resolution for detection, improving learning efficiency, discovering more object classes, and advancing fine-grained object detection.
How can I use Ultralytics YOLO to train a model on the xView dataset?
To train a model on the xView dataset using Ultralytics YOLO, follow these steps:
!!! Example "Train Example"
=== "Python"

    ```py
    from ultralytics import YOLO

    # Load a model
    model = YOLO("yolov8n.pt")  # load a pretrained model (recommended for training)

    # Train the model
    results = model.train(data="xView.yaml", epochs=100, imgsz=640)
    ```


=== "CLI"

    ```py
    # Start training from a pretrained *.pt model
    yolo detect train data=xView.yaml model=yolov8n.pt epochs=100 imgsz=640
    ```
For detailed arguments and settings, refer to the model Training page.
What are the key features of the xView dataset?
The xView dataset stands out due to its comprehensive set of features:
- Over 1 million object instances across 60 distinct classes.
- High-resolution imagery at 0.3 meters.
- Diverse object types including small, rare, and fine-grained objects, all annotated with bounding boxes.
- Availability of a pre-trained baseline model and examples in TensorFlow and PyTorch.
What is the dataset structure of xView, and how is it annotated?
The xView dataset comprises high-resolution satellite images collected from WorldView-3 satellites at a 0.3m ground sample distance. It encompasses over 1 million objects across 60 classes in approximately 1,400 km² of imagery. Each object within the dataset is annotated with bounding boxes, making it ideal for training and evaluating deep learning models for object detection in overhead imagery. For a detailed overview, you can look at the dataset structure section here.
How do I cite the xView dataset in my research?
If you utilize the xView dataset in your research, please cite the following paper:
!!! Quote "BibTeX"
```py
@misc{lam2018xview,
      title={xView: Objects in Context in Overhead Imagery},
      author={Darius Lam and Richard Kuzma and Kevin McGee and Samuel Dooley and Michael Laielli and Matthew Klaric and Yaroslav Bulatov and Brendan McCord},
      year={2018},
      eprint={1802.07856},
      archivePrefix={arXiv},
      primaryClass={cs.CV}
}
```
For more information about the xView dataset, visit the official xView dataset website.
comments: true
description: Explore the Ultralytics Explorer API for dataset exploration with SQL queries, vector similarity search, and semantic search. Learn installation and usage tips.
keywords: Ultralytics, Explorer API, dataset exploration, SQL queries, similarity search, semantic search, Python API, LanceDB, embeddings, data analysis
Ultralytics Explorer API
Introduction
![]()
The Explorer API is a Python API for exploring your datasets. It supports filtering and searching your dataset using SQL queries, vector similarity search and semantic search.
Watch: Ultralytics Explorer API Overview
Installation
Explorer depends on external libraries for some of its functionality. These are automatically installed on usage. To manually install these dependencies, use the following command:
pip install ultralytics[explorer]
Usage
from ultralytics import Explorer

# Create an Explorer object
explorer = Explorer(data="coco128.yaml", model="yolov8n.pt")

# Create embeddings for your dataset
explorer.create_embeddings_table()

# Search for similar images to a given image/images
dataframe = explorer.get_similar(img="path/to/image.jpg")

# Or search for similar images to a given index/indices
dataframe = explorer.get_similar(idx=0)
!!! Tip "Note"
Embeddings table for a given dataset and model pair is only created once and reused. These use [LanceDB](https://lancedb.github.io/lancedb/) under the hood, which scales on-disk, so you can create and reuse embeddings for large datasets like COCO without running out of memory.
In case you want to force update the embeddings table, you can pass force=True to create_embeddings_table method.
You can directly access the LanceDB table object to perform advanced analysis. Learn more about it in the Working with Embeddings Table section
1. Similarity Search
Similarity search is a technique for finding similar images to a given image. It is based on the idea that similar images will have similar embeddings. Once the embeddings table is built, you can get run semantic search in any of the following ways:
- On a given index or list of indices in the dataset:
exp.get_similar(idx=[1,10], limit=10) - On any image or list of images not in the dataset:
exp.get_similar(img=["path/to/img1", "path/to/img2"], limit=10)
In case of multiple inputs, the aggregate of their embeddings is used.
You get a pandas dataframe with the limit number of most similar data points to the input, along with their distance in the embedding space. You can use this dataset to perform further filtering
!!! Example "Semantic Search"
=== "Using Images"

    ```py
    from ultralytics import Explorer

    # create an Explorer object
    exp = Explorer(data="coco128.yaml", model="yolov8n.pt")
    exp.create_embeddings_table()

    similar = exp.get_similar(img="https://ultralytics.com/images/bus.jpg", limit=10)
    print(similar.head())

    # Search using multiple indices
    similar = exp.get_similar(
        img=["https://ultralytics.com/images/bus.jpg", "https://ultralytics.com/images/bus.jpg"],
        limit=10,
    )
    print(similar.head())
    ```

=== "Using Dataset Indices"

    ```py
    from ultralytics import Explorer

    # create an Explorer object
    exp = Explorer(data="coco128.yaml", model="yolov8n.pt")
    exp.create_embeddings_table()

    similar = exp.get_similar(idx=1, limit=10)
    print(similar.head())

    # Search using multiple indices
    similar = exp.get_similar(idx=[1, 10], limit=10)
    print(similar.head())
    ```
Plotting Similar Images
You can also plot the similar images using the plot_similar method. This method takes the same arguments as get_similar and plots the similar images in a grid.
!!! Example "Plotting Similar Images"
=== "Using Images"

    ```py
    from ultralytics import Explorer

    # create an Explorer object
    exp = Explorer(data="coco128.yaml", model="yolov8n.pt")
    exp.create_embeddings_table()

    plt = exp.plot_similar(img="https://ultralytics.com/images/bus.jpg", limit=10)
    plt.show()
    ```

=== "Using Dataset Indices"

    ```py
    from ultralytics import Explorer

    # create an Explorer object
    exp = Explorer(data="coco128.yaml", model="yolov8n.pt")
    exp.create_embeddings_table()

    plt = exp.plot_similar(idx=1, limit=10)
    plt.show()
    ```
2. Ask AI (Natural Language Querying)
This allows you to write how you want to filter your dataset using natural language. You don't have to be proficient in writing SQL queries. Our AI powered query generator will automatically do that under the hood. For example - you can say - "show me 100 images with exactly one person and 2 dogs. There can be other objects too" and it'll internally generate the query and show you those results.
Note: This works using LLMs under the hood so the results are probabilistic and might get things wrong sometimes
!!! Example "Ask AI"
```py
from ultralytics import Explorer
from ultralytics.data.explorer import plot_query_result

# create an Explorer object
exp = Explorer(data="coco128.yaml", model="yolov8n.pt")
exp.create_embeddings_table()

df = exp.ask_ai("show me 100 images with exactly one person and 2 dogs. There can be other objects too")
print(df.head())

# plot the results
plt = plot_query_result(df)
plt.show()
```
3. SQL Querying
You can run SQL queries on your dataset using the sql_query method. This method takes a SQL query as input and returns a pandas dataframe with the results.
!!! Example "SQL Query"
```py
from ultralytics import Explorer

# create an Explorer object
exp = Explorer(data="coco128.yaml", model="yolov8n.pt")
exp.create_embeddings_table()

df = exp.sql_query("WHERE labels LIKE '%person%' AND labels LIKE '%dog%'")
print(df.head())
```
Plotting SQL Query Results
You can also plot the results of a SQL query using the plot_sql_query method. This method takes the same arguments as sql_query and plots the results in a grid.
!!! Example "Plotting SQL Query Results"
```py
from ultralytics import Explorer

# create an Explorer object
exp = Explorer(data="coco128.yaml", model="yolov8n.pt")
exp.create_embeddings_table()

# plot the SQL Query
exp.plot_sql_query("WHERE labels LIKE '%person%' AND labels LIKE '%dog%' LIMIT 10")
```
4. Working with Embeddings Table
You can also work with the embeddings table directly. Once the embeddings table is created, you can access it using the Explorer.table
!!! Tip "Explorer works on LanceDB tables internally. You can access this table directly, using Explorer.table object and run raw queries, push down pre- and post-filters, etc."
```py
from ultralytics import Explorer

exp = Explorer()
exp.create_embeddings_table()
table = exp.table
```
Here are some examples of what you can do with the table:
Get raw Embeddings
!!! Example
```py
from ultralytics import Explorer

exp = Explorer()
exp.create_embeddings_table()
table = exp.table

embeddings = table.to_pandas()["vector"]
print(embeddings)
```
Advanced Querying with pre- and post-filters
!!! Example
```py
from ultralytics import Explorer

exp = Explorer(model="yolov8n.pt")
exp.create_embeddings_table()
table = exp.table

# Dummy embedding
embedding = [i for i in range(256)]
rs = table.search(embedding).metric("cosine").where("").limit(10)
```
Create Vector Index
When using large datasets, you can also create a dedicated vector index for faster querying. This is done using the create_index method on LanceDB table.
table.create_index(num_partitions=..., num_sub_vectors=...)
Find more details on the type vector indices available and parameters here In the future, we will add support for creating vector indices directly from Explorer API.
5. Embeddings Applications
You can use the embeddings table to perform a variety of exploratory analysis. Here are some examples:
Similarity Index
Explorer comes with a similarity_index operation:
- It tries to estimate how similar each data point is with the rest of the dataset.
- It does that by counting how many image embeddings lie closer than
max_distto the current image in the generated embedding space, consideringtop_ksimilar images at a time.
It returns a pandas dataframe with the following columns:
idx: Index of the image in the datasetim_file: Path to the image filecount: Number of images in the dataset that are closer thanmax_distto the current imagesim_im_files: List of paths to thecountsimilar images
!!! Tip
For a given dataset, model, `max_dist` & `top_k` the similarity index once generated will be reused. In case, your dataset has changed, or you simply need to regenerate the similarity index, you can pass `force=True`.
!!! Example "Similarity Index"
```py
from ultralytics import Explorer

exp = Explorer()
exp.create_embeddings_table()

sim_idx = exp.similarity_index()
```
You can use similarity index to build custom conditions to filter out the dataset. For example, you can filter out images that are not similar to any other image in the dataset using the following code:
import numpy as np

sim_count = np.array(sim_idx["count"])
sim_idx["im_file"][sim_count > 30]
Visualize Embedding Space
You can also visualize the embedding space using the plotting tool of your choice. For example here is a simple example using matplotlib:
import matplotlib.pyplot as plt
from sklearn.decomposition import PCA

# Reduce dimensions using PCA to 3 components for visualization in 3D
pca = PCA(n_components=3)
reduced_data = pca.fit_transform(embeddings)

# Create a 3D scatter plot using Matplotlib Axes3D
fig = plt.figure(figsize=(8, 6))
ax = fig.add_subplot(111, projection="3d")

# Scatter plot
ax.scatter(reduced_data[:, 0], reduced_data[:, 1], reduced_data[:, 2], alpha=0.5)
ax.set_title("3D Scatter Plot of Reduced 256-Dimensional Data (PCA)")
ax.set_xlabel("Component 1")
ax.set_ylabel("Component 2")
ax.set_zlabel("Component 3")

plt.show()
Start creating your own CV dataset exploration reports using the Explorer API. For inspiration, check out the
Apps Built Using Ultralytics Explorer
Try our GUI Demo based on Explorer API
Coming Soon
FAQ
What is the Ultralytics Explorer API used for?
The Ultralytics Explorer API is designed for comprehensive dataset exploration. It allows users to filter and search datasets using SQL queries, vector similarity search, and semantic search. This powerful Python API can handle large datasets, making it ideal for various computer vision tasks using Ultralytics models.
How do I install the Ultralytics Explorer API?
To install the Ultralytics Explorer API along with its dependencies, use the following command:
pip install ultralytics[explorer]
This will automatically install all necessary external libraries for the Explorer API functionality. For additional setup details, refer to the installation section of our documentation.
How can I use the Ultralytics Explorer API for similarity search?
You can use the Ultralytics Explorer API to perform similarity searches by creating an embeddings table and querying it for similar images. Here's a basic example:
from ultralytics import Explorer

# Create an Explorer object
explorer = Explorer(data="coco128.yaml", model="yolov8n.pt")
explorer.create_embeddings_table()

# Search for similar images to a given image
similar_images_df = explorer.get_similar(img="path/to/image.jpg")
print(similar_images_df.head())
For more details, please visit the Similarity Search section.
What are the benefits of using LanceDB with Ultralytics Explorer?
LanceDB, used under the hood by Ultralytics Explorer, provides scalable, on-disk embeddings tables. This ensures that you can create and reuse embeddings for large datasets like COCO without running out of memory. These tables are only created once and can be reused, enhancing efficiency in data handling.
How does the Ask AI feature work in the Ultralytics Explorer API?
The Ask AI feature allows users to filter datasets using natural language queries. This feature leverages LLMs to convert these queries into SQL queries behind the scenes. Here's an example:
from ultralytics import Explorer

# Create an Explorer object
explorer = Explorer(data="coco128.yaml", model="yolov8n.pt")
explorer.create_embeddings_table()

# Query with natural language
query_result = explorer.ask_ai("show me 100 images with exactly one person and 2 dogs. There can be other objects too")
print(query_result.head())
For more examples, check out the Ask AI section.
comments: true
description: Unlock advanced data exploration with Ultralytics Explorer GUI. Utilize semantic search, run SQL queries, and ask AI for natural language data insights.
keywords: Ultralytics Explorer GUI, semantic search, vector similarity, SQL queries, AI, natural language search, data exploration, machine learning, OpenAI, LLMs
Explorer GUI
Explorer GUI is like a playground build using Ultralytics Explorer API. It allows you to run semantic/vector similarity search, SQL queries and even search using natural language using our ask AI feature powered by LLMs.
Watch: Ultralytics Explorer Dashboard Overview
Installation
pip install ultralytics[explorer]
!!! note "Note"
Ask AI feature works using OpenAI, so you'll be prompted to set the api key for OpenAI when you first run the GUI.
You can set it like this - `yolo settings openai_api_key="..."`
Vector Semantic Similarity Search
Semantic search is a technique for finding similar images to a given image. It is based on the idea that similar images will have similar embeddings. In the UI, you can select one of more images and search for the images similar to them. This can be useful when you want to find images similar to a given image or a set of images that don't perform as expected.
For example:
In this VOC Exploration dashboard, user selects a couple airplane images like this:
On performing similarity search, you should see a similar result:
Ask AI
This allows you to write how you want to filter your dataset using natural language. You don't have to be proficient in writing SQL queries. Our AI powered query generator will automatically do that under the hood. For example - you can say - "show me 100 images with exactly one person and 2 dogs. There can be other objects too" and it'll internally generate the query and show you those results. Here's an example output when asked to "Show 10 images with exactly 5 persons" and you'll see a result like this:
Note: This works using LLMs under the hood so the results are probabilistic and might get things wrong sometimes
Run SQL queries on your CV datasets
You can run SQL queries on your dataset to filter it. It also works if you only provide the WHERE clause. Example SQL query would show only the images that have at least one 1 person and 1 dog in them:
WHERE labels LIKE '%person%' AND labels LIKE '%dog%'
This is a Demo build using the Explorer API. You can use the API to build your own exploratory notebooks or scripts to get insights into your datasets. Learn more about the Explorer API here.
FAQ
What is Ultralytics Explorer GUI and how do I install it?
Ultralytics Explorer GUI is a powerful interface that unlocks advanced data exploration capabilities using the Ultralytics Explorer API. It allows you to run semantic/vector similarity search, SQL queries, and natural language queries using the Ask AI feature powered by Large Language Models (LLMs).
To install the Explorer GUI, you can use pip:
pip install ultralytics[explorer]
Note: To use the Ask AI feature, you'll need to set the OpenAI API key: yolo settings openai_api_key="...".
How does the semantic search feature in Ultralytics Explorer GUI work?
The semantic search feature in Ultralytics Explorer GUI allows you to find images similar to a given image based on their embeddings. This technique is useful for identifying and exploring images that share visual similarities. To use this feature, select one or more images in the UI and execute a search for similar images. The result will display images that closely resemble the selected ones, facilitating efficient dataset exploration and anomaly detection.
Learn more about semantic search and other features by visiting the Feature Overview section.
Can I use natural language to filter datasets in Ultralytics Explorer GUI?
Yes, with the Ask AI feature powered by large language models (LLMs), you can filter your datasets using natural language queries. You don't need to be proficient in SQL. For instance, you can ask "Show me 100 images with exactly one person and 2 dogs. There can be other objects too," and the AI will generate the appropriate query under the hood to deliver the desired results.
See an example of a natural language query here.
How do I run SQL queries on datasets using Ultralytics Explorer GUI?
Ultralytics Explorer GUI allows you to run SQL queries directly on your dataset to filter and manage data efficiently. To run a query, navigate to the SQL query section in the GUI and write your query. For example, to show images with at least one person and one dog, you could use:
WHERE labels LIKE '%person%' AND labels LIKE '%dog%'
You can also provide only the WHERE clause, making the querying process more flexible.
For more details, refer to the SQL Queries Section.
What are the benefits of using Ultralytics Explorer GUI for data exploration?
Ultralytics Explorer GUI enhances data exploration with features like semantic search, SQL querying, and natural language interactions through the Ask AI feature. These capabilities allow users to:
- Efficiently find visually similar images.
- Filter datasets using complex SQL queries.
- Utilize AI to perform natural language searches, eliminating the need for advanced SQL expertise.
These features make it a versatile tool for developers, researchers, and data scientists looking to gain deeper insights into their datasets.
Explore more about these features in the Explorer GUI Documentation.
comments: true
description: Discover Ultralytics Explorer for semantic search, SQL queries, vector similarity, and natural language dataset exploration. Enhance your CV datasets effortlessly.
keywords: Ultralytics Explorer, CV datasets, semantic search, SQL queries, vector similarity, dataset visualization, python API, machine learning, computer vision
Ultralytics Explorer
![]()
Ultralytics Explorer is a tool for exploring CV datasets using semantic search, SQL queries, vector similarity search and even using natural language. It is also a Python API for accessing the same functionality.
Watch: Ultralytics Explorer API | Semantic Search, SQL Queries & Ask AI Features
Installation of optional dependencies
Explorer depends on external libraries for some of its functionality. These are automatically installed on usage. To manually install these dependencies, use the following command:
pip install ultralytics[explorer]
!!! tip
Explorer works on embedding/semantic search & SQL querying and is powered by [LanceDB](https://lancedb.com/) serverless vector database. Unlike traditional in-memory DBs, it is persisted on disk without sacrificing performance, so you can scale locally to large datasets like COCO without running out of memory.
Explorer API
This is a Python API for Exploring your datasets. It also powers the GUI Explorer. You can use this to create your own exploratory notebooks or scripts to get insights into your datasets.
Learn more about the Explorer API here.
GUI Explorer Usage
The GUI demo runs in your browser allowing you to create embeddings for your dataset and search for similar images, run SQL queries and perform semantic search. It can be run using the following command:
yolo explorer
!!! note "Note"
Ask AI feature works using OpenAI, so you'll be prompted to set the api key for OpenAI when you first run the GUI.
You can set it like this - `yolo settings openai_api_key="..."`
FAQ
What is Ultralytics Explorer and how can it help with CV datasets?
Ultralytics Explorer is a powerful tool designed for exploring computer vision (CV) datasets through semantic search, SQL queries, vector similarity search, and even natural language. This versatile tool provides both a GUI and a Python API, allowing users to seamlessly interact with their datasets. By leveraging technologies like LanceDB, Ultralytics Explorer ensures efficient, scalable access to large datasets without excessive memory usage. Whether you're performing detailed dataset analysis or exploring data patterns, Ultralytics Explorer streamlines the entire process.
Learn more about the Explorer API.
How do I install the dependencies for Ultralytics Explorer?
To manually install the optional dependencies needed for Ultralytics Explorer, you can use the following pip command:
pip install ultralytics[explorer]
These dependencies are essential for the full functionality of semantic search and SQL querying. By including libraries powered by LanceDB, the installation ensures that the database operations remain efficient and scalable, even for large datasets like COCO.
How can I use the GUI version of Ultralytics Explorer?
Using the GUI version of Ultralytics Explorer is straightforward. After installing the necessary dependencies, you can launch the GUI with the following command:
yolo explorer
The GUI provides a user-friendly interface for creating dataset embeddings, searching for similar images, running SQL queries, and conducting semantic searches. Additionally, the integration with OpenAI's Ask AI feature allows you to query datasets using natural language, enhancing the flexibility and ease of use.
For storage and scalability information, check out our installation instructions.
What is the Ask AI feature in Ultralytics Explorer?
The Ask AI feature in Ultralytics Explorer allows users to interact with their datasets using natural language queries. Powered by OpenAI, this feature enables you to ask complex questions and receive insightful answers without needing to write SQL queries or similar commands. To use this feature, you'll need to set your OpenAI API key the first time you run the GUI:
yolo settings openai_api_key="YOUR_API_KEY"
For more on this feature and how to integrate it, see our GUI Explorer Usage section.
Can I run Ultralytics Explorer in Google Colab?
Yes, Ultralytics Explorer can be run in Google Colab, providing a convenient and powerful environment for dataset exploration. You can start by opening the provided Colab notebook, which is pre-configured with all the necessary settings:
![]()
This setup allows you to explore your datasets fully, taking advantage of Google's cloud resources. Learn more in our Google Colab Guide.
comments: true
description: Explore Ultralytics' diverse datasets for vision tasks like detection, segmentation, classification, and more. Enhance your projects with high-quality annotated data.
keywords: Ultralytics, datasets, computer vision, object detection, instance segmentation, pose estimation, image classification, multi-object tracking
Datasets Overview
Ultralytics provides support for various datasets to facilitate computer vision tasks such as detection, instance segmentation, pose estimation, classification, and multi-object tracking. Below is a list of the main Ultralytics datasets, followed by a summary of each computer vision task and the respective datasets.
Watch: Ultralytics Datasets Overview
NEW 🚀 Ultralytics Explorer
Create embeddings for your dataset, search for similar images, run SQL queries, perform semantic search and even search using natural language! You can get started with our GUI app or build your own using the API. Learn more here.
- Try the GUI Demo
- Learn more about the Explorer API
Object Detection
Bounding box object detection is a computer vision technique that involves detecting and localizing objects in an image by drawing a bounding box around each object.
- Argoverse: A dataset containing 3D tracking and motion forecasting data from urban environments with rich annotations.
- COCO: Common Objects in Context (COCO) is a large-scale object detection, segmentation, and captioning dataset with 80 object categories.
- LVIS: A large-scale object detection, segmentation, and captioning dataset with 1203 object categories.
- COCO8: A smaller subset of the first 4 images from COCO train and COCO val, suitable for quick tests.
- Global Wheat 2020: A dataset containing images of wheat heads for the Global Wheat Challenge 2020.
- Objects365: A high-quality, large-scale dataset for object detection with 365 object categories and over 600K annotated images.
- OpenImagesV7: A comprehensive dataset by Google with 1.7M train images and 42k validation images.
- SKU-110K: A dataset featuring dense object detection in retail environments with over 11K images and 1.7 million bounding boxes.
- VisDrone: A dataset containing object detection and multi-object tracking data from drone-captured imagery with over 10K images and video sequences.
- VOC: The Pascal Visual Object Classes (VOC) dataset for object detection and segmentation with 20 object classes and over 11K images.
- xView: A dataset for object detection in overhead imagery with 60 object categories and over 1 million annotated objects.
- Roboflow 100: A diverse object detection benchmark with 100 datasets spanning seven imagery domains for comprehensive model evaluation.
- Brain-tumor: A dataset for detecting brain tumors includes MRI or CT scan images with details on tumor presence, location, and characteristics.
- African-wildlife: A dataset featuring images of African wildlife, including buffalo, elephant, rhino, and zebras.
- Signature: A dataset featuring images of various documents with annotated signatures, supporting document verification and fraud detection research.
Instance Segmentation
Instance segmentation is a computer vision technique that involves identifying and localizing objects in an image at the pixel level.
- COCO: A large-scale dataset designed for object detection, segmentation, and captioning tasks with over 200K labeled images.
- COCO8-seg: A smaller dataset for instance segmentation tasks, containing a subset of 8 COCO images with segmentation annotations.
- Crack-seg: Specifically crafted dataset for detecting cracks on roads and walls, applicable for both object detection and segmentation tasks.
- Package-seg: Tailored dataset for identifying packages in warehouses or industrial settings, suitable for both object detection and segmentation applications.
- Carparts-seg: Purpose-built dataset for identifying vehicle parts, catering to design, manufacturing, and research needs. It serves for both object detection and segmentation tasks.
Pose Estimation
Pose estimation is a technique used to determine the pose of the object relative to the camera or the world coordinate system.
- COCO: A large-scale dataset with human pose annotations designed for pose estimation tasks.
- COCO8-pose: A smaller dataset for pose estimation tasks, containing a subset of 8 COCO images with human pose annotations.
- Tiger-pose: A compact dataset consisting of 263 images focused on tigers, annotated with 12 keypoints per tiger for pose estimation tasks.
Classification
Image classification is a computer vision task that involves categorizing an image into one or more predefined classes or categories based on its visual content.
- Caltech 101: A dataset containing images of 101 object categories for image classification tasks.
- Caltech 256: An extended version of Caltech 101 with 256 object categories and more challenging images.
- CIFAR-10: A dataset of 60K 32x32 color images in 10 classes, with 6K images per class.
- CIFAR-100: An extended version of CIFAR-10 with 100 object categories and 600 images per class.
- Fashion-MNIST: A dataset consisting of 70,000 grayscale images of 10 fashion categories for image classification tasks.
- ImageNet: A large-scale dataset for object detection and image classification with over 14 million images and 20,000 categories.
- ImageNet-10: A smaller subset of ImageNet with 10 categories for faster experimentation and testing.
- Imagenette: A smaller subset of ImageNet that contains 10 easily distinguishable classes for quicker training and testing.
- Imagewoof: A more challenging subset of ImageNet containing 10 dog breed categories for image classification tasks.
- MNIST: A dataset of 70,000 grayscale images of handwritten digits for image classification tasks.
Oriented Bounding Boxes (OBB)
Oriented Bounding Boxes (OBB) is a method in computer vision for detecting angled objects in images using rotated bounding boxes, often applied to aerial and satellite imagery.
- DOTA-v2: A popular OBB aerial imagery dataset with 1.7 million instances and 11,268 images.
Multi-Object Tracking
Multi-object tracking is a computer vision technique that involves detecting and tracking multiple objects over time in a video sequence.
- Argoverse: A dataset containing 3D tracking and motion forecasting data from urban environments with rich annotations for multi-object tracking tasks.
- VisDrone: A dataset containing object detection and multi-object tracking data from drone-captured imagery with over 10K images and video sequences.
Contribute New Datasets
Contributing a new dataset involves several steps to ensure that it aligns well with the existing infrastructure. Below are the necessary steps:
Steps to Contribute a New Dataset
-
Collect Images: Gather the images that belong to the dataset. These could be collected from various sources, such as public databases or your own collection.
-
Annotate Images: Annotate these images with bounding boxes, segments, or keypoints, depending on the task.
-
Export Annotations: Convert these annotations into the YOLO
*.txtfile format which Ultralytics supports. -
Organize Dataset: Arrange your dataset into the correct folder structure. You should have
train/andval/top-level directories, and within each, animages/andlabels/subdirectory.dataset/ ├── train/ │ ├── images/ │ └── labels/ └── val/ ├── images/ └── labels/ -
Create a
data.yamlFile: In your dataset's root directory, create adata.yamlfile that describes the dataset, classes, and other necessary information. -
Optimize Images (Optional): If you want to reduce the size of the dataset for more efficient processing, you can optimize the images using the code below. This is not required, but recommended for smaller dataset sizes and faster download speeds.
-
Zip Dataset: Compress the entire dataset folder into a zip file.
-
Document and PR: Create a documentation page describing your dataset and how it fits into the existing framework. After that, submit a Pull Request (PR). Refer to Ultralytics Contribution Guidelines for more details on how to submit a PR.
Example Code to Optimize and Zip a Dataset
!!! Example "Optimize and Zip a Dataset"
=== "Python"

   ```py
   from pathlib import Path

   from ultralytics.data.utils import compress_one_image
   from ultralytics.utils.downloads import zip_directory

   # Define dataset directory
   path = Path("path/to/dataset")

   # Optimize images in dataset (optional)
   for f in path.rglob("*.jpg"):
       compress_one_image(f)

   # Zip dataset into 'path/to/dataset.zip'
   zip_directory(path)
   ```
By following these steps, you can contribute a new dataset that integrates well with Ultralytics' existing structure.
FAQ
What datasets does Ultralytics support for object detection?
Ultralytics supports a wide variety of datasets for object detection, including:
- COCO: A large-scale object detection, segmentation, and captioning dataset with 80 object categories.
- LVIS: An extensive dataset with 1203 object categories, designed for more fine-grained object detection and segmentation.
- Argoverse: A dataset containing 3D tracking and motion forecasting data from urban environments with rich annotations.
- VisDrone: A dataset with object detection and multi-object tracking data from drone-captured imagery.
- SKU-110K: Featuring dense object detection in retail environments with over 11K images.
These datasets facilitate training robust models for various object detection applications.
How do I contribute a new dataset to Ultralytics?
Contributing a new dataset involves several steps:
- Collect Images: Gather images from public databases or personal collections.
- Annotate Images: Apply bounding boxes, segments, or keypoints, depending on the task.
- Export Annotations: Convert annotations into the YOLO
*.txtformat. - Organize Dataset: Use the folder structure with
train/andval/directories, each containingimages/andlabels/subdirectories. - Create a
data.yamlFile: Include dataset descriptions, classes, and other relevant information. - Optimize Images (Optional): Reduce dataset size for efficiency.
- Zip Dataset: Compress the dataset into a zip file.
- Document and PR: Describe your dataset and submit a Pull Request following Ultralytics Contribution Guidelines.
Visit Contribute New Datasets for a comprehensive guide.
Why should I use Ultralytics Explorer for my dataset?
Ultralytics Explorer offers powerful features for dataset analysis, including:
- Embeddings Generation: Create vector embeddings for images.
- Semantic Search: Search for similar images using embeddings or AI.
- SQL Queries: Run advanced SQL queries for detailed data analysis.
- Natural Language Search: Search using plain language queries for ease of use.
Explore the Ultralytics Explorer for more information and to try the GUI Demo.
What are the unique features of Ultralytics YOLO models for computer vision?
Ultralytics YOLO models provide several unique features:
- Real-time Performance: High-speed inference and training.
- Versatility: Suitable for detection, segmentation, classification, and pose estimation tasks.
- Pretrained Models: Access to high-performing, pretrained models for various applications.
- Extensive Community Support: Active community and comprehensive documentation for troubleshooting and development.
Discover more about YOLO on the Ultralytics YOLO page.
How can I optimize and zip a dataset using Ultralytics tools?
To optimize and zip a dataset using Ultralytics tools, follow this example code:
!!! Example "Optimize and Zip a Dataset"
=== "Python"

    ```py
    from pathlib import Path

    from ultralytics.data.utils import compress_one_image
    from ultralytics.utils.downloads import zip_directory

    # Define dataset directory
    path = Path("path/to/dataset")

    # Optimize images in dataset (optional)
    for f in path.rglob("*.jpg"):
        compress_one_image(f)

    # Zip dataset into 'path/to/dataset.zip'
    zip_directory(path)
    ```
Learn more on how to Optimize and Zip a Dataset.
comments: true
description: Explore the DOTA dataset for object detection in aerial images, featuring 1.7M Oriented Bounding Boxes across 18 categories. Ideal for aerial image analysis.
keywords: DOTA dataset, object detection, aerial images, oriented bounding boxes, OBB, DOTA v1.0, DOTA v1.5, DOTA v2.0, multiscale detection, Ultralytics
DOTA Dataset with OBB
DOTA stands as a specialized dataset, emphasizing object detection in aerial images. Originating from the DOTA series of datasets, it offers annotated images capturing a diverse array of aerial scenes with Oriented Bounding Boxes (OBB).
Key Features
- Collection from various sensors and platforms, with image sizes ranging from 800 × 800 to 20,000 × 20,000 pixels.
- Features more than 1.7M Oriented Bounding Boxes across 18 categories.
- Encompasses multiscale object detection.
- Instances are annotated by experts using arbitrary (8 d.o.f.) quadrilateral, capturing objects of different scales, orientations, and shapes.
Dataset Versions
DOTA-v1.0
- Contains 15 common categories.
- Comprises 2,806 images with 188,282 instances.
- Split ratios: 1/2 for training, 1/6 for validation, and 1/3 for testing.
DOTA-v1.5
- Incorporates the same images as DOTA-v1.0.
- Very small instances (less than 10 pixels) are also annotated.
- Addition of a new category: "container crane".
- A total of 403,318 instances.
- Released for the DOAI Challenge 2019 on Object Detection in Aerial Images.
DOTA-v2.0
- Collections from Google Earth, GF-2 Satellite, and other aerial images.
- Contains 18 common categories.
- Comprises 11,268 images with a whopping 1,793,658 instances.
- New categories introduced: "airport" and "helipad".
- Image splits:
- Training: 1,830 images with 268,627 instances.
- Validation: 593 images with 81,048 instances.
- Test-dev: 2,792 images with 353,346 instances.
- Test-challenge: 6,053 images with 1,090,637 instances.
Dataset Structure
DOTA exhibits a structured layout tailored for OBB object detection challenges:
- Images: A vast collection of high-resolution aerial images capturing diverse terrains and structures.
- Oriented Bounding Boxes: Annotations in the form of rotated rectangles encapsulating objects irrespective of their orientation, ideal for capturing objects like airplanes, ships, and buildings.
Applications
DOTA serves as a benchmark for training and evaluating models specifically tailored for aerial image analysis. With the inclusion of OBB annotations, it provides a unique challenge, enabling the development of specialized object detection models that cater to aerial imagery's nuances.
Dataset YAML
Typically, datasets incorporate a YAML (Yet Another Markup Language) file detailing the dataset's configuration. For DOTA v1 and DOTA v1.5, Ultralytics provides DOTAv1.yaml and DOTAv1.5.yaml files. For additional details on these as well as DOTA v2 please consult DOTA's official repository and documentation.
!!! Example "DOTAv1.yaml"
```py
--8<-- "ultralytics/cfg/datasets/DOTAv1.yaml"
```
Split DOTA images
To train DOTA dataset, we split original DOTA images with high-resolution into images with 1024x1024 resolution in multiscale way.
!!! Example "Split images"
=== "Python"

    ```py
    from ultralytics.data.split_dota import split_test, split_trainval

    # split train and val set, with labels.
    split_trainval(
        data_root="path/to/DOTAv1.0/",
        save_dir="path/to/DOTAv1.0-split/",
        rates=[0.5, 1.0, 1.5],  # multiscale
        gap=500,
    )
    # split test set, without labels.
    split_test(
        data_root="path/to/DOTAv1.0/",
        save_dir="path/to/DOTAv1.0-split/",
        rates=[0.5, 1.0, 1.5],  # multiscale
        gap=500,
    )
    ```
Usage
To train a model on the DOTA v1 dataset, you can utilize the following code snippets. Always refer to your model's documentation for a thorough list of available arguments.
!!! Warning
Please note that all images and associated annotations in the DOTAv1 dataset can be used for academic purposes, but commercial use is prohibited. Your understanding and respect for the dataset creators' wishes are greatly appreciated!
!!! Example "Train Example"
=== "Python"

    ```py
    from ultralytics import YOLO

    # Create a new YOLOv8n-OBB model from scratch
    model = YOLO("yolov8n-obb.yaml")

    # Train the model on the DOTAv2 dataset
    results = model.train(data="DOTAv1.yaml", epochs=100, imgsz=640)
    ```

=== "CLI"

    ```py
    # Train a new YOLOv8n-OBB model on the DOTAv2 dataset
    yolo obb train data=DOTAv1.yaml model=yolov8n-obb.pt epochs=100 imgsz=640
    ```
Sample Data and Annotations
Having a glance at the dataset illustrates its depth:
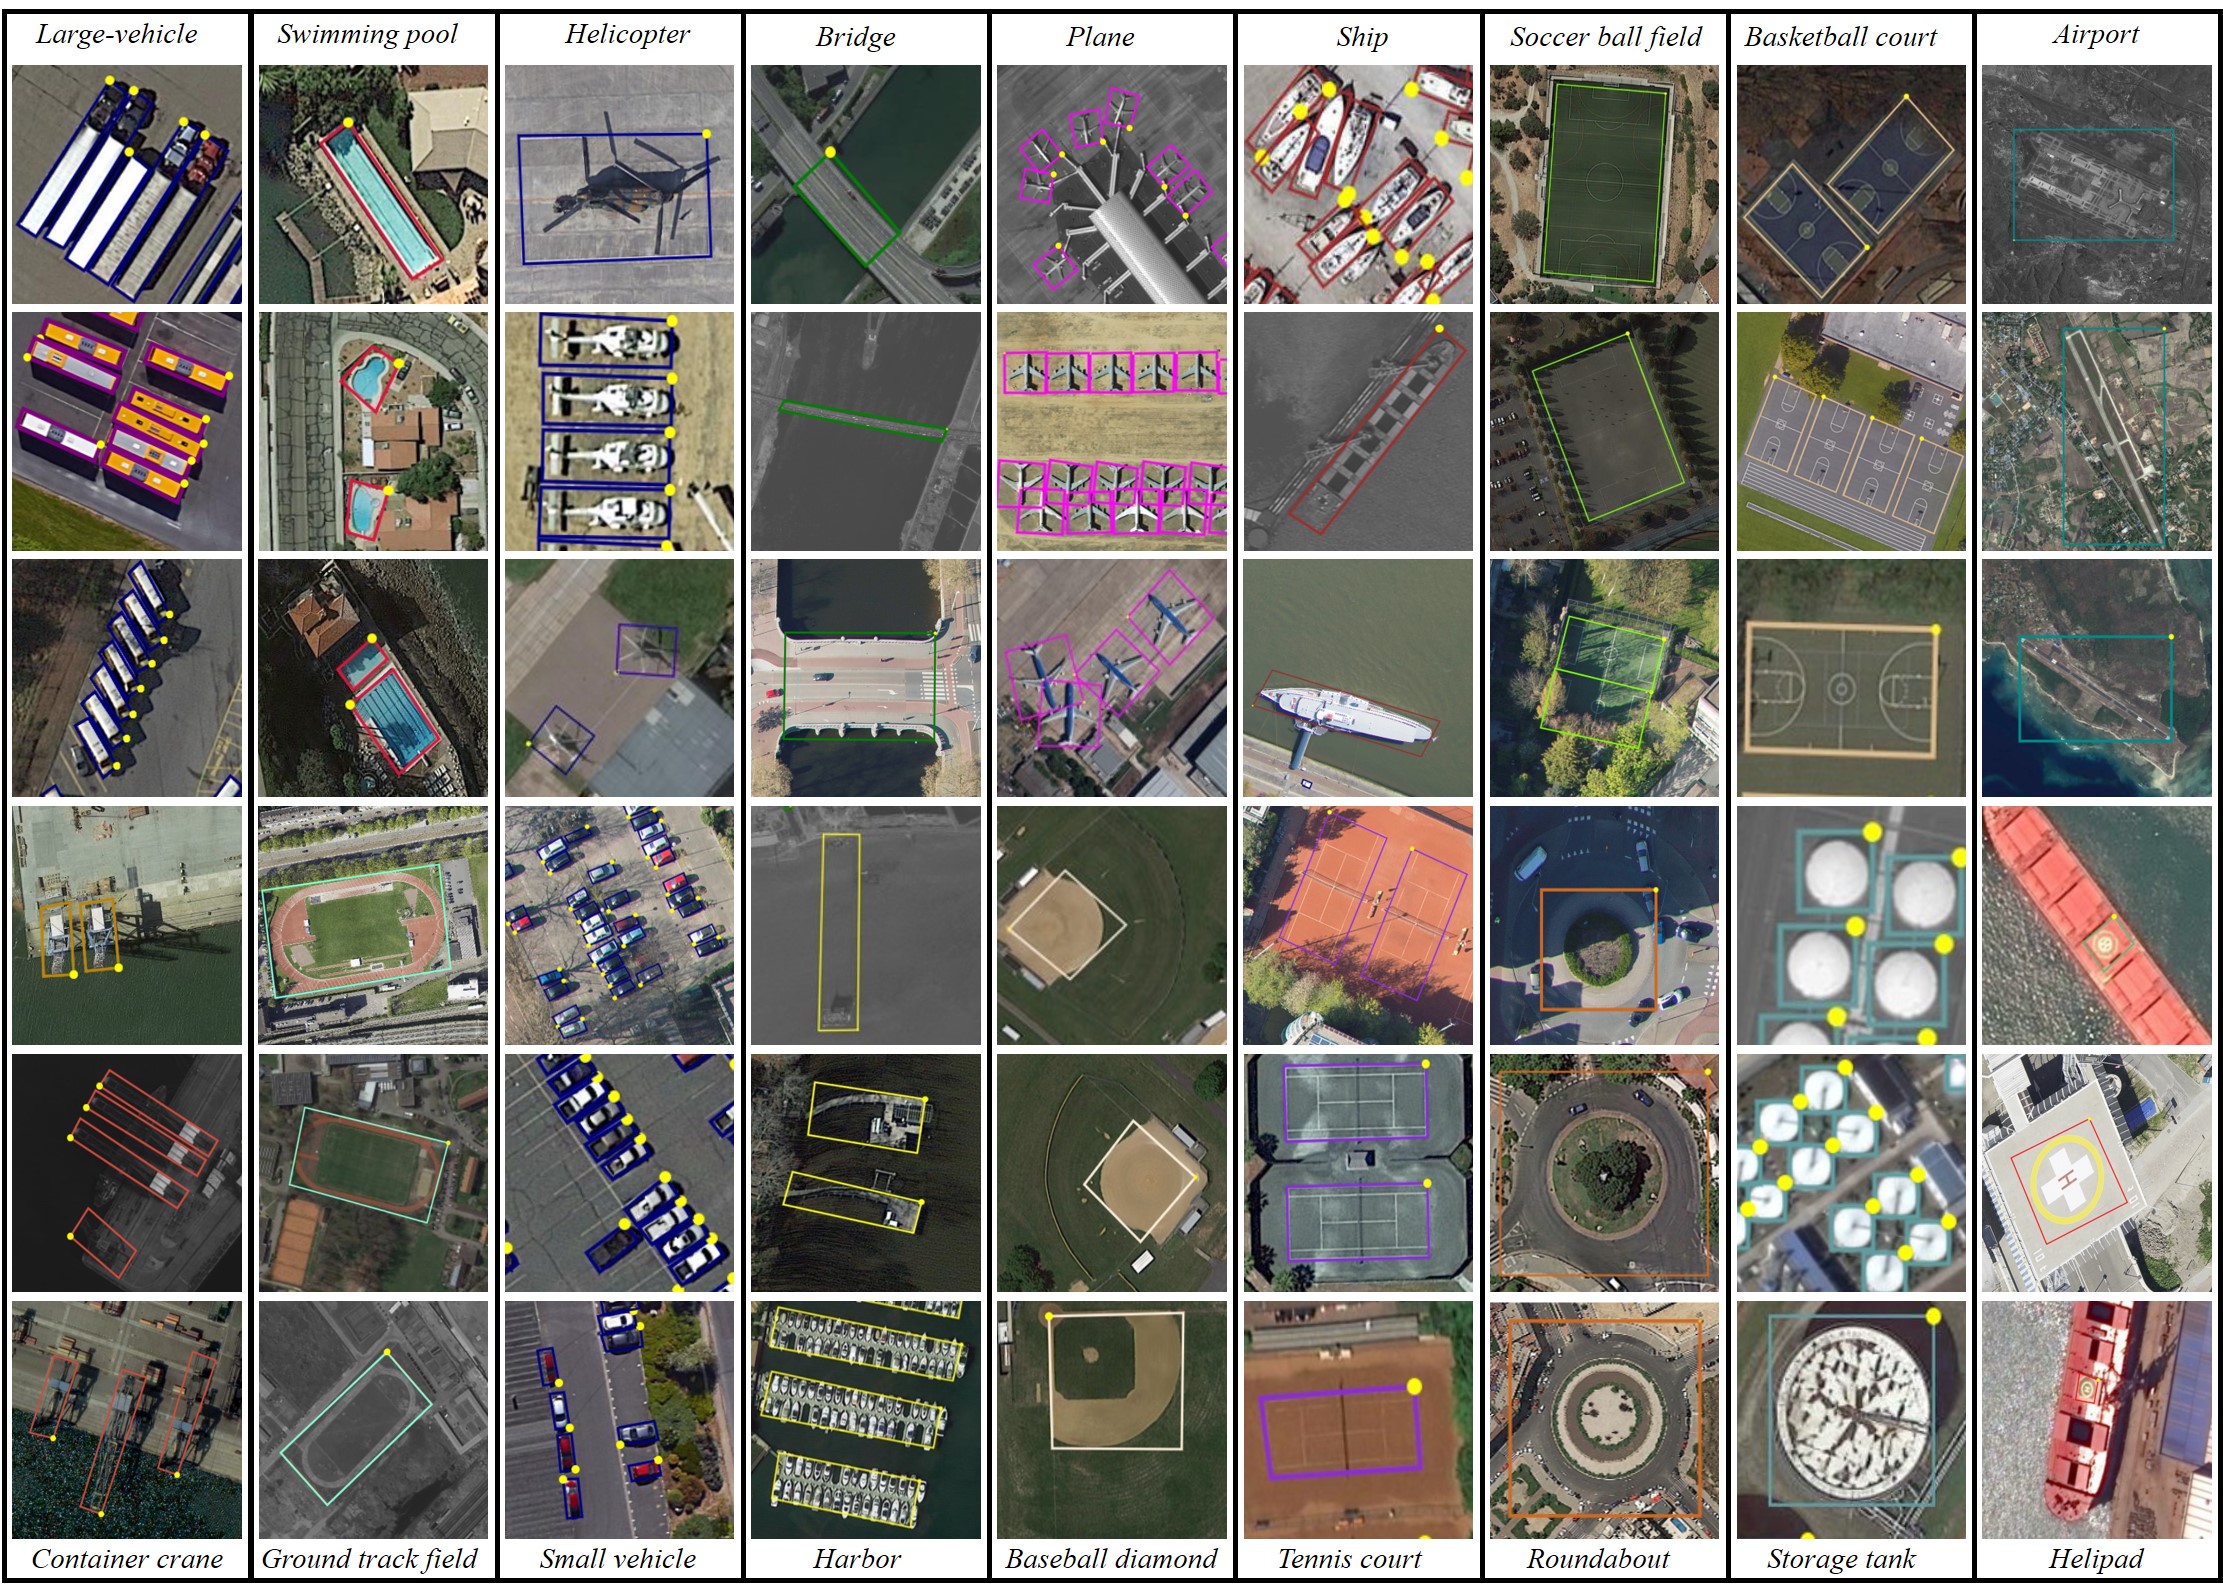
- DOTA examples: This snapshot underlines the complexity of aerial scenes and the significance of Oriented Bounding Box annotations, capturing objects in their natural orientation.
The dataset's richness offers invaluable insights into object detection challenges exclusive to aerial imagery.
Citations and Acknowledgments
For those leveraging DOTA in their endeavors, it's pertinent to cite the relevant research papers:
!!! Quote ""
=== "BibTeX"

    ```py
    @article{9560031,
      author={Ding, Jian and Xue, Nan and Xia, Gui-Song and Bai, Xiang and Yang, Wen and Yang, Michael and Belongie, Serge and Luo, Jiebo and Datcu, Mihai and Pelillo, Marcello and Zhang, Liangpei},
      journal={IEEE Transactions on Pattern Analysis and Machine Intelligence},
      title={Object Detection in Aerial Images: A Large-Scale Benchmark and Challenges},
      year={2021},
      volume={},
      number={},
      pages={1-1},
      doi={10.1109/TPAMI.2021.3117983}
    }
    ```
A special note of gratitude to the team behind the DOTA datasets for their commendable effort in curating this dataset. For an exhaustive understanding of the dataset and its nuances, please visit the official DOTA website.
FAQ
What is the DOTA dataset and why is it important for object detection in aerial images?
The DOTA dataset is a specialized dataset focused on object detection in aerial images. It features Oriented Bounding Boxes (OBB), providing annotated images from diverse aerial scenes. DOTA's diversity in object orientation, scale, and shape across its 1.7M annotations and 18 categories makes it ideal for developing and evaluating models tailored for aerial imagery analysis, such as those used in surveillance, environmental monitoring, and disaster management.
How does the DOTA dataset handle different scales and orientations in images?
DOTA utilizes Oriented Bounding Boxes (OBB) for annotation, which are represented by rotated rectangles encapsulating objects regardless of their orientation. This method ensures that objects, whether small or at different angles, are accurately captured. The dataset's multiscale images, ranging from 800 × 800 to 20,000 × 20,000 pixels, further allow for the detection of both small and large objects effectively.
How can I train a model using the DOTA dataset?
To train a model on the DOTA dataset, you can use the following example with Ultralytics YOLO:
!!! Example "Train Example"
=== "Python"

    ```py
    from ultralytics import YOLO

    # Create a new YOLOv8n-OBB model from scratch
    model = YOLO("yolov8n-obb.yaml")

    # Train the model on the DOTAv1 dataset
    results = model.train(data="DOTAv1.yaml", epochs=100, imgsz=640)
    ```

=== "CLI"

    ```py
    # Train a new YOLOv8n-OBB model on the DOTAv1 dataset
    yolo obb train data=DOTAv1.yaml model=yolov8n-obb.pt epochs=100 imgsz=640
    ```
For more details on how to split and preprocess the DOTA images, refer to the split DOTA images section.
What are the differences between DOTA-v1.0, DOTA-v1.5, and DOTA-v2.0?
-
DOTA-v1.0: Includes 15 common categories across 2,806 images with 188,282 instances. The dataset is split into training, validation, and testing sets.
-
DOTA-v1.5: Builds upon DOTA-v1.0 by annotating very small instances (less than 10 pixels) and adding a new category, "container crane," totaling 403,318 instances.
-
DOTA-v2.0: Expands further with annotations from Google Earth and GF-2 Satellite, featuring 11,268 images and 1,793,658 instances. It includes new categories like "airport" and "helipad."
For a detailed comparison and additional specifics, check the dataset versions section.
How can I prepare high-resolution DOTA images for training?
DOTA images, which can be very large, are split into smaller resolutions for manageable training. Here's a Python snippet to split images:
!!! Example
=== "Python"

    ```py
    from ultralytics.data.split_dota import split_test, split_trainval

    # split train and val set, with labels.
    split_trainval(
        data_root="path/to/DOTAv1.0/",
        save_dir="path/to/DOTAv1.0-split/",
        rates=[0.5, 1.0, 1.5],  # multiscale
        gap=500,
    )
    # split test set, without labels.
    split_test(
        data_root="path/to/DOTAv1.0/",
        save_dir="path/to/DOTAv1.0-split/",
        rates=[0.5, 1.0, 1.5],  # multiscale
        gap=500,
    )
    ```
This process facilitates better training efficiency and model performance. For detailed instructions, visit the split DOTA images section.
comments: true
description: Explore the DOTA8 dataset - a small, versatile oriented object detection dataset ideal for testing and debugging object detection models using Ultralytics YOLOv8.
keywords: DOTA8 dataset, Ultralytics, YOLOv8, object detection, debugging, training models, oriented object detection, dataset YAML
DOTA8 Dataset
Introduction
Ultralytics DOTA8 is a small, but versatile oriented object detection dataset composed of the first 8 images of 8 images of the split DOTAv1 set, 4 for training and 4 for validation. This dataset is ideal for testing and debugging object detection models, or for experimenting with new detection approaches. With 8 images, it is small enough to be easily manageable, yet diverse enough to test training pipelines for errors and act as a sanity check before training larger datasets.
This dataset is intended for use with Ultralytics HUB and YOLOv8.
Dataset YAML
A YAML (Yet Another Markup Language) file is used to define the dataset configuration. It contains information about the dataset's paths, classes, and other relevant information. In the case of the DOTA8 dataset, the dota8.yaml file is maintained at https://github.com/ultralytics/ultralytics/blob/main/ultralytics/cfg/datasets/dota8.yaml.
!!! Example "ultralytics/cfg/datasets/dota8.yaml"
```py
--8<-- "ultralytics/cfg/datasets/dota8.yaml"
```
Usage
To train a YOLOv8n-obb model on the DOTA8 dataset for 100 epochs with an image size of 640, you can use the following code snippets. For a comprehensive list of available arguments, refer to the model Training page.
!!! Example "Train Example"
=== "Python"

    ```py
    from ultralytics import YOLO

    # Load a model
    model = YOLO("yolov8n-obb.pt")  # load a pretrained model (recommended for training)

    # Train the model
    results = model.train(data="dota8.yaml", epochs=100, imgsz=640)
    ```

=== "CLI"

    ```py
    # Start training from a pretrained *.pt model
    yolo obb train data=dota8.yaml model=yolov8n-obb.pt epochs=100 imgsz=640
    ```
Sample Images and Annotations
Here are some examples of images from the DOTA8 dataset, along with their corresponding annotations:
- Mosaiced Image: This image demonstrates a training batch composed of mosaiced dataset images. Mosaicing is a technique used during training that combines multiple images into a single image to increase the variety of objects and scenes within each training batch. This helps improve the model's ability to generalize to different object sizes, aspect ratios, and contexts.
The example showcases the variety and complexity of the images in the DOTA8 dataset and the benefits of using mosaicing during the training process.
Citations and Acknowledgments
If you use the DOTA dataset in your research or development work, please cite the following paper:
!!! Quote ""
=== "BibTeX"

    ```py
    @article{9560031,
      author={Ding, Jian and Xue, Nan and Xia, Gui-Song and Bai, Xiang and Yang, Wen and Yang, Michael and Belongie, Serge and Luo, Jiebo and Datcu, Mihai and Pelillo, Marcello and Zhang, Liangpei},
      journal={IEEE Transactions on Pattern Analysis and Machine Intelligence},
      title={Object Detection in Aerial Images: A Large-Scale Benchmark and Challenges},
      year={2021},
      volume={},
      number={},
      pages={1-1},
      doi={10.1109/TPAMI.2021.3117983}
    }
    ```
A special note of gratitude to the team behind the DOTA datasets for their commendable effort in curating this dataset. For an exhaustive understanding of the dataset and its nuances, please visit the official DOTA website.
FAQ
What is the DOTA8 dataset and how can it be used?
The DOTA8 dataset is a small, versatile oriented object detection dataset made up of the first 8 images from the DOTAv1 split set, with 4 images designated for training and 4 for validation. It's ideal for testing and debugging object detection models like Ultralytics YOLOv8. Due to its manageable size and diversity, it helps in identifying pipeline errors and running sanity checks before deploying larger datasets. Learn more about object detection with Ultralytics YOLOv8.
How do I train a YOLOv8 model using the DOTA8 dataset?
To train a YOLOv8n-obb model on the DOTA8 dataset for 100 epochs with an image size of 640, you can use the following code snippets. For comprehensive argument options, refer to the model Training page.
!!! Example "Train Example"
=== "Python"

    ```py
    from ultralytics import YOLO

    # Load a model
    model = YOLO("yolov8n-obb.pt")  # load a pretrained model (recommended for training)

    # Train the model
    results = model.train(data="dota8.yaml", epochs=100, imgsz=640)
    ```

=== "CLI"

    ```py
    # Start training from a pretrained *.pt model
    yolo obb train data=dota8.yaml model=yolov8n-obb.pt epochs=100 imgsz=640
    ```
What are the key features of the DOTA dataset and where can I access the YAML file?
The DOTA dataset is known for its large-scale benchmark and the challenges it presents for object detection in aerial images. The DOTA8 subset is a smaller, manageable dataset ideal for initial tests. You can access the dota8.yaml file, which contains paths, classes, and configuration details, at this GitHub link.
How does mosaicing enhance model training with the DOTA8 dataset?
Mosaicing combines multiple images into one during training, increasing the variety of objects and contexts within each batch. This improves a model's ability to generalize to different object sizes, aspect ratios, and scenes. This technique can be visually demonstrated through a training batch composed of mosaiced DOTA8 dataset images, helping in robust model development. Explore more about mosaicing and training techniques on our Training page.
Why should I use Ultralytics YOLOv8 for object detection tasks?
Ultralytics YOLOv8 provides state-of-the-art real-time object detection capabilities, including features like oriented bounding boxes (OBB), instance segmentation, and a highly versatile training pipeline. It's suitable for various applications and offers pretrained models for efficient fine-tuning. Explore further about the advantages and usage in the Ultralytics YOLOv8 documentation.
comments: true
description: Discover OBB dataset formats for Ultralytics YOLO models. Learn about their structure, application, and format conversions to enhance your object detection training.
keywords: Oriented Bounding Box, OBB Datasets, YOLO, Ultralytics, Object Detection, Dataset Formats
Oriented Bounding Box (OBB) Datasets Overview
Training a precise object detection model with oriented bounding boxes (OBB) requires a thorough dataset. This guide explains the various OBB dataset formats compatible with Ultralytics YOLO models, offering insights into their structure, application, and methods for format conversions.
Supported OBB Dataset Formats
YOLO OBB Format
The YOLO OBB format designates bounding boxes by their four corner points with coordinates normalized between 0 and 1. It follows this format:
class_index x1 y1 x2 y2 x3 y3 x4 y4
Internally, YOLO processes losses and outputs in the xywhr format, which represents the bounding box's center point (xy), width, height, and rotation.

An example of a *.txt label file for the above image, which contains an object of class 0 in OBB format, could look like:
0 0.780811 0.743961 0.782371 0.74686 0.777691 0.752174 0.776131 0.749758
Usage
To train a model using these OBB formats:
!!! Example
=== "Python"

    ```py
    from ultralytics import YOLO

    # Create a new YOLOv8n-OBB model from scratch
    model = YOLO("yolov8n-obb.yaml")

    # Train the model on the DOTAv2 dataset
    results = model.train(data="DOTAv1.yaml", epochs=100, imgsz=640)
    ```

=== "CLI"

    ```py
    # Train a new YOLOv8n-OBB model on the DOTAv2 dataset
    yolo detect train data=DOTAv1.yaml model=yolov8n.pt epochs=100 imgsz=640
    ```
Supported Datasets
Currently, the following datasets with Oriented Bounding Boxes are supported:
- DOTA-v2: DOTA (A Large-scale Dataset for Object Detection in Aerial Images) version 2, emphasizes detection from aerial perspectives and contains oriented bounding boxes with 1.7 million instances and 11,268 images.
- DOTA8: A small, 8-image subset of the full DOTA dataset suitable for testing workflows and Continuous Integration (CI) checks of OBB training in the
ultralyticsrepository.
Incorporating your own OBB dataset
For those looking to introduce their own datasets with oriented bounding boxes, ensure compatibility with the "YOLO OBB format" mentioned above. Convert your annotations to this required format and detail the paths, classes, and class names in a corresponding YAML configuration file.
Convert Label Formats
DOTA Dataset Format to YOLO OBB Format
Transitioning labels from the DOTA dataset format to the YOLO OBB format can be achieved with this script:
!!! Example
=== "Python"

    ```py
    from ultralytics.data.converter import convert_dota_to_yolo_obb

    convert_dota_to_yolo_obb("path/to/DOTA")
    ```
This conversion mechanism is instrumental for datasets in the DOTA format, ensuring alignment with the Ultralytics YOLO OBB format.
It's imperative to validate the compatibility of the dataset with your model and adhere to the necessary format conventions. Properly structured datasets are pivotal for training efficient object detection models with oriented bounding boxes.
FAQ
What are Oriented Bounding Boxes (OBB) and how are they used in Ultralytics YOLO models?
Oriented Bounding Boxes (OBB) are a type of bounding box annotation where the box can be rotated to align more closely with the object being detected, rather than just being axis-aligned. This is particularly useful in aerial or satellite imagery where objects might not be aligned with the image axes. In Ultralytics YOLO models, OBBs are represented by their four corner points in the YOLO OBB format. This allows for more accurate object detection since the bounding boxes can rotate to fit the objects better.
How do I convert my existing DOTA dataset labels to YOLO OBB format for use with Ultralytics YOLOv8?
You can convert DOTA dataset labels to YOLO OBB format using the convert_dota_to_yolo_obb function from Ultralytics. This conversion ensures compatibility with the Ultralytics YOLO models, enabling you to leverage the OBB capabilities for enhanced object detection. Here's a quick example:
from ultralytics.data.converter import convert_dota_to_yolo_obb

convert_dota_to_yolo_obb("path/to/DOTA")
This script will reformat your DOTA annotations into a YOLO-compatible format.
How do I train a YOLOv8 model with oriented bounding boxes (OBB) on my dataset?
Training a YOLOv8 model with OBBs involves ensuring your dataset is in the YOLO OBB format and then using the Ultralytics API to train the model. Here's an example in both Python and CLI:
!!! Example
=== "Python"

    ```py
    from ultralytics import YOLO

    # Create a new YOLOv8n-OBB model from scratch
    model = YOLO("yolov8n-obb.yaml")

    # Train the model on the custom dataset
    results = model.train(data="your_dataset.yaml", epochs=100, imgsz=640)
    ```


=== "CLI"

    ```py
    # Train a new YOLOv8n-OBB model on the custom dataset
    yolo detect train data=your_dataset.yaml model=yolov8n.pt epochs=100 imgsz=640
    ```
This ensures your model leverages the detailed OBB annotations for improved detection accuracy.
What datasets are currently supported for OBB training in Ultralytics YOLO models?
Currently, Ultralytics supports the following datasets for OBB training:
- DOTA-v2: This dataset includes 1.7 million instances with oriented bounding boxes and 11,268 images, primarily focusing on aerial object detection.
- DOTA8: A smaller, 8-image subset of the DOTA dataset used for testing and continuous integration (CI) checks.
These datasets are tailored for scenarios where OBBs offer a significant advantage, such as aerial and satellite image analysis.
Can I use my own dataset with oriented bounding boxes for YOLOv8 training, and if so, how?
Yes, you can use your own dataset with oriented bounding boxes for YOLOv8 training. Ensure your dataset annotations are converted to the YOLO OBB format, which involves defining bounding boxes by their four corner points. You can then create a YAML configuration file specifying the dataset paths, classes, and other necessary details. For more information on creating and configuring your datasets, refer to the Supported Datasets section.


 浙公网安备 33010602011771号