Error Budgets includes:
- releasing new feature
- expected system change
- inevitable failure in hardware, network etc
- planned downtime
- risky experiment
- share responsibility for reliability between Ops and Dev teams.
- reduce feature iteration speed when our systems are unreliable.
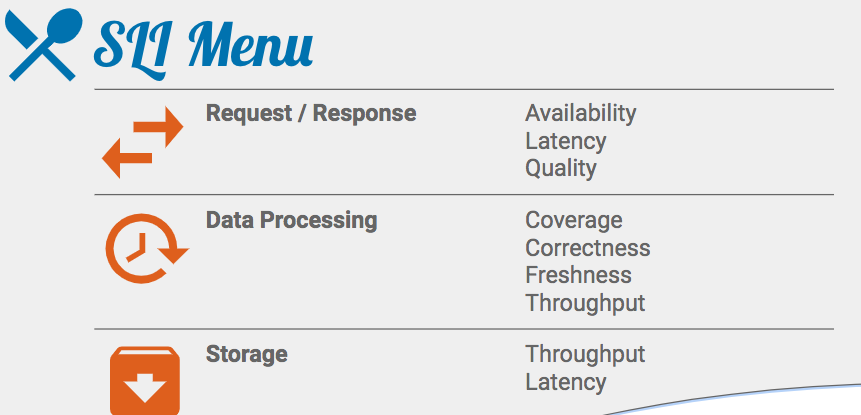
SLI Metrics:
https://cre.page.link/art-of-slos-handbook page 6 .
Example avalibility SLI:
The proportion of valid requests served successfully.
Example latency SLI:
The proportion of valid requests served faster than a threshold.
Example quality SLI:
The proportion of valid requests served without degrading quality.
![]()
User Journey: Home Page Load
SLI Type: Latency
SLI Specification:
Proportion of home page requests that were served in < 100ms
(Above, “[home page requests] served in <100ms” is the numerator in the SLI Equation, and “home page requests” is the denominator.)
SLI Implementations:
-
Proportion of home page requests served in < 100ms, as measured from the 'latency' column of the server log.
(Pros/Cons: This measurement will miss requests that fail to reach the backend.)
-
Proportion of home page requests served in < 100ms, as measured by probers that execute javascript in a browser running in a virtual machine.
(Pros/Cons: This will catch errors when requests cannot reach our network, but may miss issues affecting only a subset of users.)
SLO:
99% of home page requests in the past 28 days served in < 100ms. |
Measuring SLI:
Application-level Metrics
|
Pros
|
Cons
|
-
Often fast and cheap (in terms of engineering time) to add new metrics.
-
Complex logic to derive an SLI implementation can be turned into code and exported as two, much simpler, "good events" and "total events" counters.
|
|
Logs Processing
rocessing server-side logs of requests or data to generate SLI metrics.
|
Pros
|
Cons
|
-
Existing request logs can be processed retroactively to backfill SLI metrics.
-
Complex user journeys can be reconstructed using session identifiers.
-
Complex logic to derive an SLI implementation can be turned into code and exported as two, much simpler, "good events" and "total events" counters.
|
-
Application logs do not contain requests that did not reach servers.
-
Processing latency makes logs-based SLIs unsuitable for triggering an operational response.
-
Engineering effort is needed to generate SLIs from logs; session reconstruction can be time-consuming.
|
Front-end infrastructure metrcis
|
Pros
|
Cons
|
-
Metrics and recent historical data most likely already exist, so this option probably requires the least engineering effort to get started.
-
Measures SLIs at the point closest to the user still within serving infrastructure.
|
-
Not viable for data processing SLIs or, in fact, any SLIs with complex requirements.
-
Only measure approximate performance of multi-request user journeys.
|
Probers
|
Pros
|
Cons
|
|
|
-
Approximates user experience with synthetic requests.
-
Covering all corner cases is hard and can devolve into integration testing.
-
High reliability targets require frequent probing for accurate measurement.
-
Probe traffic can drown out real traffic.
|
Client Instrumentation
|
Pros
|
Cons
|
-
+ Provides the most accurate measure of user experience. +
-
Can quantify reliability of third parties, e.g., CDN or payments providers.
|
-
Client logs ingestion, and processing latency make these SLIs unsuitable for triggering an operational response.
-
– SLI measurements contain a number of highly variable factors potentially outside of direct control.
-
– Building instrumentation into the client can involve lots of engineering work.
|


 浙公网安备 33010602011771号