ELK日志分析系统
ELK日志分析系统
在日常工作中会面临很多问题,一般通过工作经验和软件自带的日志或者系统日志来解决问题,如果1台或者几台服务器,我们可以通过 linux命令,tail、cat通过grep、awk等过滤去查询定位日志查问题,如果有几十台几百台的话这样的操作太繁琐效率低也不现实。所以建立出了一套集中式的方法
一个完整的集中式日志系统,需要包含以下几个主要特点:
- 收集-能够采集多种来源的日志数据
- 传输-能够稳定的把日志数据传输到中央系统
- 存储-如何存储日志数据
- 分析-可以支持 UI 分析
- 警告-能够提供错误报告,监控机制
ELK提供了一整套解决方案,并且都是开源软件,之间互相配合使用,完美衔接,高效的满足了很多场合的应用。目前主流的一种日志系统。
ELK简介
ELK是三个开源软件的缩写,分别为:Elasticsearch 、 Logstash以及Kibana , 它们都是开源软件。不过现在还新增了一个Beats,它是一个轻量级的日志收集处理工具(Agent),Beats占用资源少,适合于在各个服务器上搜集日志后传输给Logstash,官方也推荐此工具,目前由于原本的ELK Stack成员中加入了 Beats 工具所以已改名为Elastic Stack。
Elasticsearch是个开源分布式搜索引擎,提供搜集、分析、存储数据三大功能。它的特点有:分布式,零配置,自动发现,索引自动分片,索引副本机制,restful风格接口,多数据源,自动搜索负载等。
Logstash 主要是用来日志的搜集、分析、过滤日志的工具,支持大量的数据获取方式。一般工作方式为c/s架构,client端安装在需要收集日志的主机上,server端负责将收到的各节点日志进行过滤、修改等操作在一并发往elasticsearch上去。
Kibana 也是一个开源和免费的工具,Kibana可以为 Logstash 和 ElasticSearch 提供的日志分析友好的 Web 界面,可以帮助汇总、分析和搜索重要数据日志。
Beats在这里是一个轻量级日志采集器,其实Beats家族有6个成员,早期的ELK架构中使用Logstash收集、解析日志,但是Logstash对内存、cpu、io等资源消耗比较高。相比 Logstash,Beats所占系统的CPU和内存几乎可以忽略不计。
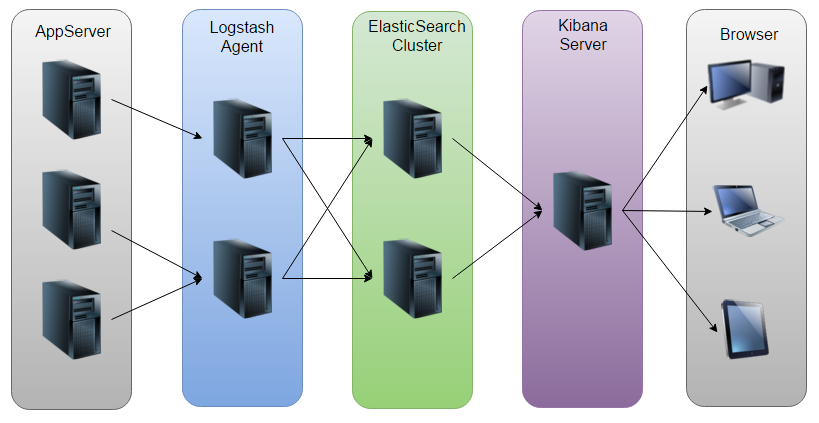
ELK工作原理
ELK部署搭建
1、基础环境
1个主节点,2个数据节点,3台机器全部安装jdk8(openjdk即可)Yum install -y java-1.8.0-openjdk
| 虚拟机IP | 部署工具 | 主机名 |
|---|---|---|
| 192.168.200.11 | elasticsearch+kibana | elk-1 |
| 192.168.200.12 | elasticsearch+logstash | elk-2 |
| 192.168.200.13 | elasticsearch | elk-3 |
2、配置三台主机的hosts文件
三台一样即可
[root@elk-1 ~]# cat /etc/hosts
127.0.0.1   localhost localhost.localdomain localhost4 localhost4.localdomain4
::1         localhost localhost.localdomain localhost6 localhost6.localdomain6
192.168.200.11 elk-1
192.168.200.12 elk-2
192.168.200.13 elk-3
3、在三台虚拟机上部署elasticsearch
将elasticsearch上传到/root下并安装:
[root@elk-1 ~]# rpm -ivh elasticsearch-6.0.0.rpm    //其他两台也安装
warning: elasticsearch-6.0.0.rpm: Header V4 RSA/SHA512 Signature, key ID d88e42b4: NOKEY
Preparing...                          ################################# [100%]
Creating elasticsearch group... OK
Creating elasticsearch user... OK
Updating / installing...
   1:elasticsearch-0:6.0.0-1          ################################# [100%]
### NOT starting on installation, please execute the following statements to configure elasticsearch service to start automatically using systemd
 sudo systemctl daemon-reload
 sudo systemctl enable elasticsearch.service
### You can start elasticsearch service by executing
 sudo systemctl start elasticsearch.service
修改三台的elasticsearch配置文件:
[root@elk-1 ~]# cat /etc/elasticsearch/elasticsearch.yml |grep -v ^#
cluster.name: ELK
node.name: elk-1
node.master: true
node.data: false
path.data: /var/lib/elasticsearch
path.logs: /var/log/elasticsearch
network.host: 192.168.200.11
http.port: 9200
discovery.zen.ping.unicast.hosts: ["elk-1", "elk-2","elk-3"]

[root@elk-2 ~]# cat /etc/elasticsearch/elasticsearch.yml | grep -v ^#
cluster.name: ELK
node.name: elk-2
node.master: false
node.data: true
path.data: /var/lib/elasticsearch
path.logs: /var/log/elasticsearch
network.host: 192.168.200.12
http.port: 9200
discovery.zen.ping.unicast.hosts: ["elk-1", "elk-2","elk-3"]

[root@elk-3 ~]# cat /etc/elasticsearch/elasticsearch.yml | grep -v ^#
cluster.name: ELK
node.name: elk-3
node.master: false
node.data: true
path.data: /var/lib/elasticsearch
path.logs: /var/log/elasticsearch
network.host: 192.168.200.13
http.port: 9200
discovery.zen.ping.unicast.hosts: ["elk-1", "elk-2","elk-3"]
通过命令启动elasticsearch查看运行状态(三台命令相同,出现9200和9300则启动成功):
[root@elk-1 ~]# systemctl restart elasticsearch.service
[root@elk-1 ~]# netstat -ntlp
Active Internet connections (only servers)
Proto Recv-Q Send-Q Local Address           Foreign Address         State       PID/Program name
tcp        0      0 0.0.0.0:22              0.0.0.0:*               LISTEN      911/sshd
tcp        0      0 127.0.0.1:25            0.0.0.0:*               LISTEN      1002/master
tcp6       0      0 192.168.200.11:9200     :::*                    LISTEN      12367/java
tcp6       0      0 192.168.200.11:9300     :::*                    LISTEN      12367/java
tcp6       0      0 :::22                   :::*                    LISTEN      911/sshd
tcp6       0      0 ::1:25                  :::*                    LISTEN      1002/master
检测集群状态:
[root@elk-1 ~]# curl '192.168.200.11:9200/_cluster/health?pretty'
{
  "cluster_name" : "ELK",
  "status" : "green",	//为green则代表健康没问题,yellow或者red	则是集群有问题
  "timed_out" : false,	//是否有超时
  "number_of_nodes" : 3, //集群中的节点数量
  "number_of_data_nodes" : 2,	//集群中data节点的数量
  "active_primary_shards" : 1,
  "active_shards" : 2,
  "relocating_shards" : 0,
  "initializing_shards" : 0,
  "unassigned_shards" : 0,
  "delayed_unassigned_shards" : 0,
  "number_of_pending_tasks" : 0,
  "number_of_in_flight_fetch" : 0,
  "task_max_waiting_in_queue_millis" : 0,
  "active_shards_percent_as_number" : 100.0
}
4、部署kibana
在主节点11上部署kibana,将kibana的rpm包上传到/root下
[root@elk-1 ~]# rpm -ivh kibana-6.0.0-x86_64.rpm
warning: kibana-6.0.0-x86_64.rpm: Header V4 RSA/SHA512 Signature, key ID d88e42b4: NOKEY
Preparing...                          ################################# [100%]
Updating / installing...
   1:kibana-6.0.0-1                   ################################# [100%]
修改kibana配置文件
[root@elk-1 ~]# cat /etc/kibana/kibana.yml | grep -v ^# | grep -v ^$
server.port: 5601
server.host: "192.168.200.11"
elasticsearch.url: "http://192.168.200.11:9200"
启动kibana
[root@elk-1 ~]# systemctl restart kibana.service
[root@elk-1 ~]#  ps -ef |grep kibana
kibana    12580      1 20 10:25 ?        00:00:02 /usr/share/kibana/bin/../node/bin/node --no-warnings /usr/share/kibana/bin/../src/cli -c /etc/kibana/kibana.yml
root      12597   2263  0 10:25 pts/1    00:00:00 grep --color=auto kibana
[root@elk-1 ~]# netstat -ntlp | grep node
tcp        0      0 192.168.200.11:5601     0.0.0.0:*               LISTEN      12580/node
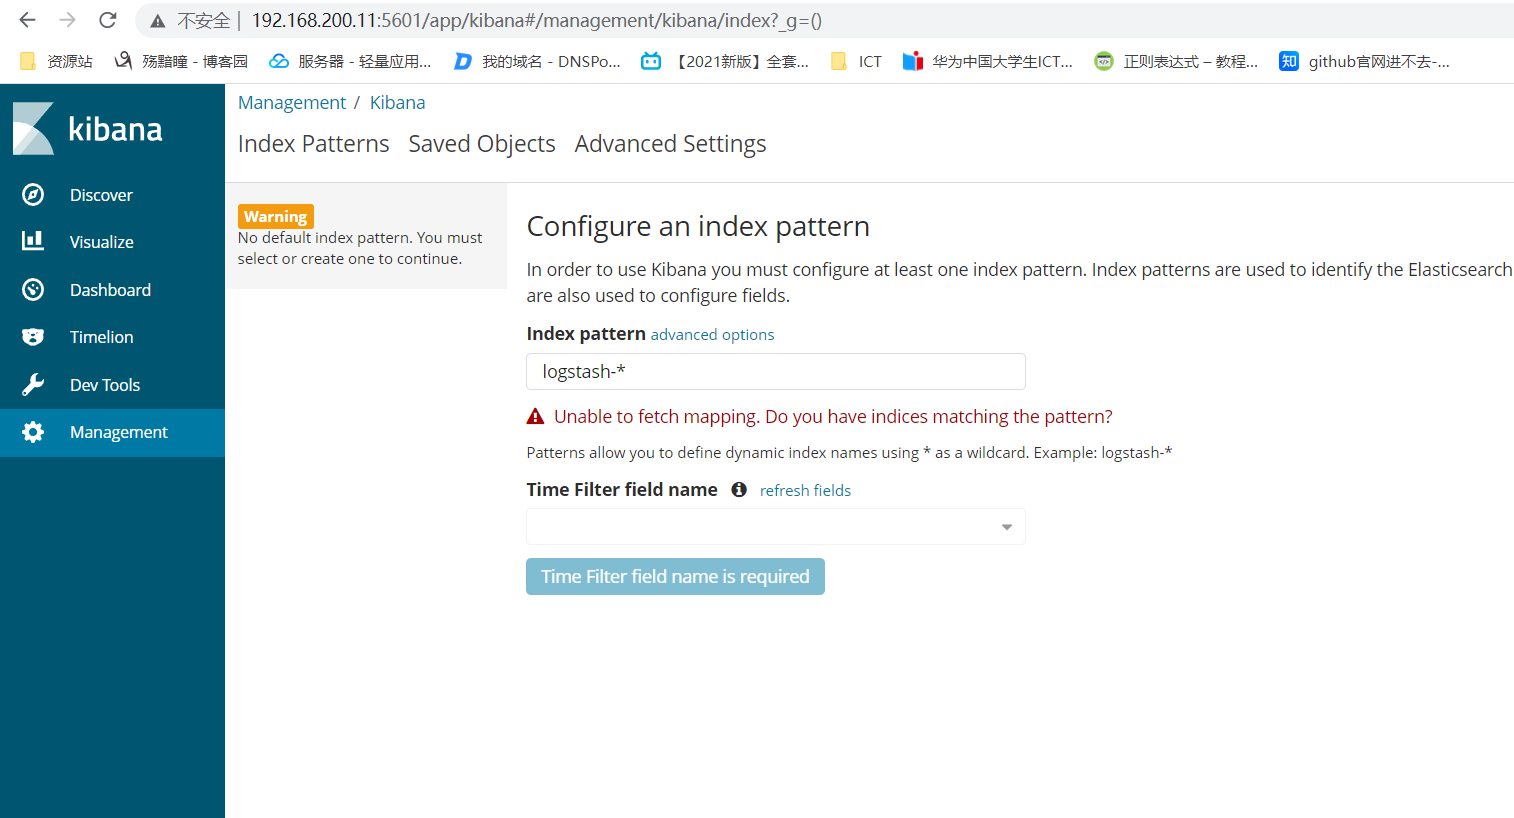
在浏览器访问192.168.200.11:5601
5、部署logstash
在elk-2上传logstash的rpm包到/root下并安装
[root@elk-2 ~]# rpm -ivh logstash-6.0.0.rpm
warning: logstash-6.0.0.rpm: Header V4 RSA/SHA512 Signature, key ID d88e42b4: NOKEY
Preparing...                          ################################# [100%]
Updating / installing...
   1:logstash-1:6.0.0-1               ################################# [100%]
Using provided startup.options file: /etc/logstash/startup.options
Successfully created system startup script for Logstash
修改logstash配置文件
[root@elk-2 ~]# vi /etc/logstash/logstash.yml
//修改第190行
http.host: "192.168.200.12"
配置logstash收集syslog日志
[root@elk-2 ~]# vim /etc/logstash/syslog.conf
input {
        file {
                path => "/var/log/messages" //需要为这个目录修改644权限
                type => "systemlog"
                start_position => "beginning"
                stat_interval => "3"
        }
}
output {
     if [type] == "systemlog" {
        elasticsearch {
            hosts => ["192.168.200.11:9200"]
            index => "system-log-%{+YYYY.MM.dd}"
        }
     }
}
[root@elk-2 ~]# chmod 644 -R /var/log/messages
[root@elk-2 ~]# chown -R logstash /var/lib/logstash/
检测配置文件是否错误
[root@elk-2 ~]#  ln -s /usr/share/logstash/bin/logstash /usr/bin
[root@elk-2 ~]# logstash --path.settings /etc/logstash/ -f /etc/logstash/conf.d/syslog.conf --config.test_and_exit
Sending Logstash's logs to /var/log/logstash which is now configured via log4j2.properties
Configuration OK
启动logstash,并查看端口
[root@elk-2 ~]# systemctl restart logstash.service
[root@elk-2 ~]# netstat -ntlp | grep 9600
tcp6       0      0 192.168.200.12:9600     :::*                    LISTEN      12890/java
6、在kibana上查看日志
使用elk-3远程登陆elk-2使其生成日志
[root@elk-1 ~]# curl '192.168.200.11:9200/_cat/indices?v'
health status index                 uuid                   pri rep docs.count docs.deleted store.size pri.store.size
green  open   .kibana               eL1dAxyBTr6TTGptG0z29g   1   1          1            0      7.3kb          3.6kb
green  open   system-log-2021.11.01 _0u6J8_TQK2xrYsUZqr_Qw   5   1      10330            0      4.5mb          2.3mb
[root@elk-1 ~]# curl -XGET/DELETE '192.168.200.11:9200/system-log-2021.11.01?pretty'
{
  "system-log-2021.11.01" : {
    "aliases" : { },
    "mappings" : {
      "systemlog" : {
        "properties" : {
          "@timestamp" : {
            "type" : "date"
          },
          "@version" : {
            "type" : "text",
            "fields" : {
              "keyword" : {
                "type" : "keyword",
                "ignore_above" : 256
              }
            }
          },
          "host" : {
            "type" : "text",
            "fields" : {
              "keyword" : {
                "type" : "keyword",
                "ignore_above" : 256
              }
            }
          },
          "message" : {
            "type" : "text",
            "fields" : {
              "keyword" : {
                "type" : "keyword",
                "ignore_above" : 256
              }
            }
          },
          "path" : {
            "type" : "text",
            "fields" : {
              "keyword" : {
                "type" : "keyword",
                "ignore_above" : 256
              }
            }
          },
          "type" : {
            "type" : "text",
            "fields" : {
              "keyword" : {
                "type" : "keyword",
                "ignore_above" : 256
              }
            }
          }
        }
      }
    },
    "settings" : {
      "index" : {
        "creation_date" : "1635734784607",
        "number_of_shards" : "5",
        "number_of_replicas" : "1",
        "uuid" : "_0u6J8_TQK2xrYsUZqr_Qw",
        "version" : {
          "created" : "6000099"
        },
        "provided_name" : "system-log-2021.11.01"
      }
    }
  }
}
7、Logstash收集Nginx日志
在elk-2上安装Nginx
[root@elk-2 ~]# rpm -ivh nginx-1.16.1-1.el7.ngx.x86_64.rpm
warning: nginx-1.16.1-1.el7.ngx.x86_64.rpm: Header V4 RSA/SHA1 Signature, key ID 7bd9bf62: NOKEY
Preparing...                          ################################# [100%]
Updating / installing...
   1:nginx-1:1.16.1-1.el7.ngx         ################################# [100%]
配置Logstash,检查文件是否正确
[root@elk-2 ~]# vim /etc/logstash/conf.d/nginx.conf
input {
  file {
   path => "/tmp/elk_access.log"
   start_position => "beginning"
   type => "nginx"
  }
}
filter {
    grok {
        match => { "message" => "%{IPORHOST:http_host} %{IPORHOST:clientip} - % {USERNAME:remote_user} \[%{HTTPDATE:timest
amp}\] \"(?:%{WORD:http_verb} %{NOTSPACE:http_request}(?: HTTP/%{NUMBER:http_version})?|%{DATA:raw_http_request})\" %{NUMB
ER:response} (?:%{NUMBER:bytes_read}|-) %{QS:referrer} %{QS:agent} %{QS:xforwardedfor} %{NUMBER:request_time:float}"}
}
geoip {
    source => "clientip"
}
}
output {
stdout { codec => rubydebug }
elasticsearch {
    hosts => ["192.168.200.11:9200"]
index => "nginx-test-%{+YYYY.MM.dd}"
  }
}
[root@elk-2 ~]# logstash --path.settings /etc/logstash/ -f /etc/logstash/conf.d/nginx.conf --config.test_and_exit
Sending Logstash's logs to /var/log/logstash which is now configured via log4j2.properties
Configuration OK
编辑监听Nginx日志配置文件
[root@elk-1 ~]# vi /etc/nginx/conf.d/elk.conf
server {
        listen 80;
        server_name elk.com;

        location / {
            proxy_pass      http://192.168.40.11:5601;
            proxy_set_header Host   $host;
            proxy_set_header X-Real-IP      $remote_addr;
            proxy_set_header X-Forwarded-For $proxy_add_x_forwarded_for;
        }
        access_log  /tmp/elk_access.log main2;
}
修改Nginx日志配置文件
[root@elk-1 ~]# vim /etc/nginx/nginx.conf
//在http里添加以下内容
log_format main2 '$http_host $remote_addr - $remote_user [$time_local] "$request" '
                  '$status $body_bytes_sent "$http_referer" '
                  '"$http_user_agent" "$upstream_addr" $request_time';
[root@elk-2 ~]# nginx -t
nginx: the configuration file /etc/nginx/nginx.conf syntax is ok
nginx: configuration file /etc/nginx/nginx.conf test is successful
[root@elk-2 ~]# systemctl start nginx
[root@elk-2 ~]# systemctl restart logstash
8、使用beats采集日志
在elk-3上安装Beats
[root@elk-3 ~]# rpm -ivh filebeat-6.0.0-x86_64.rpm
warning: filebeat-6.0.0-x86_64.rpm: Header V4 RSA/SHA512 Signature, key ID d88e42b4: NOKEY
Preparing...                          ################################# [100%]
Updating / installing...
   1:filebeat-6.0.0-1                 ################################# [100%]
修改Beats的配置文件
[root@elk-3 ~]#  vim /etc/filebeat/filebeat.yml
filebeat.prospectors:
#enabled: false //注释掉该参数
paths:
- /var/log/elasticsearch/ELK.log	//此处可自行改为想要监听的日志文件
output.elasticsearch:
  hosts: ["192.168.40.11:9200"]
[root@elk-3 ~]#  systemctl start  filebeat
在elk-1上使用curl '192.168.200.11:9200/_cat/indices?v’
[root@elk-1 ~]# curl '192.168.200.11:9200/_cat/indices?v'
health status index                     uuid                   pri rep docs.count docs.deleted store.size pri.store.size
green  open   nginx-test-2021.11.01     aZqM9gJ0RgqwZCw8Zfmr9w   5   1      10544            0      3.1mb          1.6mb
green  open   .kibana                   eL1dAxyBTr6TTGptG0z29g   1   1          2            0     14.1kb            7kb
green  open   system-log-2021.11.01     _0u6J8_TQK2xrYsUZqr_Qw   5   1      20877            0      9.3mb          4.9mb
green  open   filebeat-6.0.0-2021.11.01 u0ZqpY7iTzC5B4nL2bRlFQ   3   1         59            0     80.2kb         31.4kb

