Table of Contents
1 mechanisms
1.1 gcc cyg_profile_func_enter()/cyg_profile_func_exit() hooks
When compile source file using gcc -finstrument-functions,
gcc will instrument code to call __cyg_profile_func_enter() when enter every function,
call __cyg_profile_func_exit() when exit every function. We can define our own __cyg_profile*() functions to record function call trace.
1.2 using LD_PRELOAD environment to provide __cyg_profile*() implementations
Using __cyg_profile*() hooks means you need to recompile the executable with new CFLAGS -finstrument-functions if you want to get its function call trace.
But by setting LD_PRELOAD environment variable we don't need to add __cyg_profile*() definitions to target source file directly. we can provide __cyg_profile*() function implementations
in a shared object file trace.so, and set LD_PRELOAD to the path of trace.so before launching the executable.
1.3 using graphviz to generate png/svg call graph
Once we get the function enter/exit trace, we can calculate call graph attributes, filter out less important calls, emphasis import calls etc. then generate a dot file.
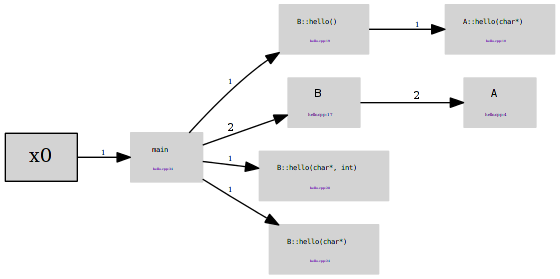
Finally, feed the dot file to graphviz to get png/svg format call graph.
2 usage
2.1 compile executable with -finstrument-functions -g CFLAGS.
export CC='gcc -finstrument-functions -g'
export CXX='gcc -finstrument-functions -g'
./configure && make # if you want to instrument other people's program
$(CC) a.c -o a.out  # if you want to instrument your own single source file.
2.2 generate trace or call graph
we provide a python script trace.py to launch program, all stuff in one comand
TRACE=trace.svg ./trace.py ./a.out # generate trace.trace and trace.svg
TRACE=trace.trace ./trace.py  ./a.out # generate trace.trace only
TRACE=trace.svg EXEFILE=./a.out ./trace.py # generate trace.svg using trace.trace recorded before.
TRACE=trace.svg EXEFILE=./a.out TOPN=10 ./trace.py # same as above, but only keep top 10 frequently calls


