vue 项目引入 echarts折线图
一。components文件下新建 lineCharts.vue
<template>
  <div :class="className" :style="{ height: height, width: width }" />
</template>

<script>
import * as echarts from 'echarts'
require('echarts/theme/macarons') // echarts theme

export default {

  props: {
    className: {
      type: String,
      default: 'chart'
    },
    width: {
      type: String,
      default: '100%'
    },
    height: {
      type: String,
      default: '400px'
    },
    autoResize: {
      type: Boolean,
      default: true
    },
    chartData: {
      type: Object,
      required: true
    }
  },
  data() {
    return {
      chart: null
    }
  },
  watch: {
    chartData: {
      deep: true,
      handler(val) {
        this.setOptions(val)
      }
    }
  },
  mounted() {
    this.$nextTick(() => {
      this.initChart()
    })
  },
  beforeDestroy() {
    if (!this.chart) {
      return
    }
    this.chart.dispose()
    this.chart = null
  },
  methods: {
    initChart() {
      this.chart = echarts.init(this.$el, 'macarons')
      this.setOptions(this.chartData)
    },
    setOptions({ expectedData, actualData } = {}) {
      this.chart.setOption({
        legend: {
          data: ['AC06H', 'AC06L', 'AC12N', 'AC12S', 'AC13E'],
          textStyle: {
            color: '#fff'
          }
        },
        grid: {
          left: '3%',
          right: '4%',
          bottom: '3%',
          containLabel: true
        },
        toolbox: {
          feature: {
            saveAsImage: {}
          }
        },
        xAxis: {
          type: 'category',
          boundaryGap: false,
          data: ['1', '2', '3', '4', '5', '6', '7', '8', '9', '10','11', '12', '13', '14', '15','16','17','18','19','20']
        },
        yAxis: {
          type: 'value'
        },
        series: [
          {
            name: 'AC06H',
            type: 'line',
            stack: 'Total',
            smooth: false,
            data: [691,301, 134, 590, 634, 420, 132, 530, 310,301,254, 320, 590, 134, 530, 310, 590,90, 230, 210],
            itemStyle: {
              normal: {
                //areaStyle: {type: 'default',color:'#d5f0fd'}, //阴影颜色
                lineStyle:{color:'#00ffff'}
              }
            },
          },
          {
            name: 'AC06L',
            type: 'line',
            stack: 'Total',
            smooth: false,
            data: [220, 382, 691,301, 134, 590, 634,520,34,123,90,691,301, 400,254, 320, 590,120, 530, 310],
            itemStyle: {
              normal: {
                lineStyle:{color:'#ff00ff'}
              }
            },
          },
          {
            name: 'AC12N',
            type: 'line',
            stack: 'Total',
            smooth: false,
            data: [150, 432, 101,254, 720, 590,120, 530, 382, 101, 682,390, 30, 520,691,301, 254, 320, 130, 410],
            itemStyle: {
              normal: {
                lineStyle:{color:'#fff'}
              }
            },
          },
          {
            name: 'AC12S',
            type: 'line',
            stack: 'Total',
            smooth: false,
            data: [320, 832, 101,600, 382,434, 210, 330, 50, 90, 501, 834,100, 432, 101, 382,590, 130, 400,520],
            itemStyle: {
              normal: {
                lineStyle:{color:'#00a0e9'}
              }
            },
          },
          {
            name: 'AC13E',
            type: 'line',
            stack: 'Total',
            smooth: false,
            data: [600, 382,434, 210, 330, 120, 232, 201, 501, 834, 432, 101, 382,434, 10, 330, 120 ,832, 501, 834,],
            itemStyle: {
              normal: {
                lineStyle:{color:'#ffff00'}
              }
            },
          }
        ]
      })
    }
  }
}
</script>
二。需要用到的页面引入组件:

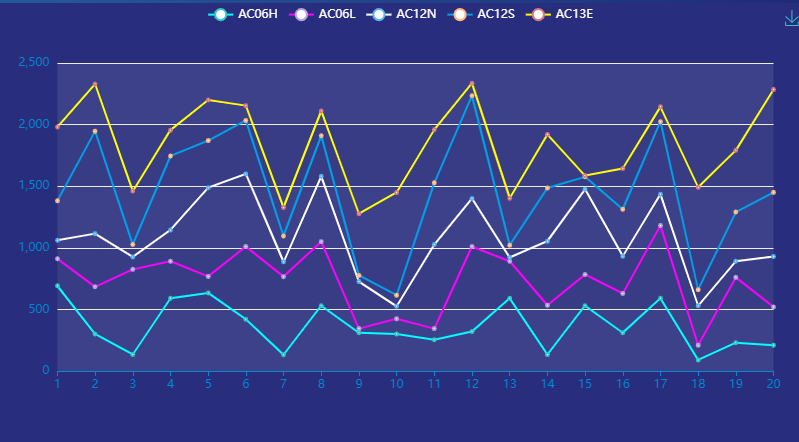
效果图如下:

 浙公网安备 33010602011771号