
使用FFT判断滤波器类型
import cv2 as cv
import numpy as np
from matplotlib import pyplot as plt
# 没有缩放参数的简单均值滤波器
mean_filter = np.ones((3,3))
# 创建高斯滤波器
x = cv.getGaussianKernel(5,10)
gaussian = x*x.T
# 不同的边缘检测滤波器
# x方向上的scharr
scharr = np.array([[-3, 0, 3],
[-10,0,10],
[-3, 0, 3]])
# x方向上的sobel
sobel_x= np.array([[-1, 0, 1],
[-2, 0, 2],
[-1, 0, 1]])
# y方向上的sobel
sobel_y= np.array([[-1,-2,-1],
[0, 0, 0],
[1, 2, 1]])
# 拉普拉斯变换
laplacian=np.array([[0, 1, 0],
[1,-4, 1],
[0, 1, 0]])
filters = [mean_filter, gaussian, laplacian, sobel_x, sobel_y, scharr]
filter_name = ['mean_filter', 'gaussian','laplacian', 'sobel_x', \
'sobel_y', 'scharr_x']
fft_filters = [np.fft.fft2(x) for x in filters]
fft_shift = [np.fft.fftshift(y) for y in fft_filters]
mag_spectrum = [np.log(np.abs(z)+1) for z in fft_shift]
for i in xrange(6):
plt.subplot(2,3,i+1),plt.imshow(mag_spectrum[i],cmap = 'gray')
plt.title(filter_name[i]), plt.xticks([]), plt.yticks([])
plt.show()
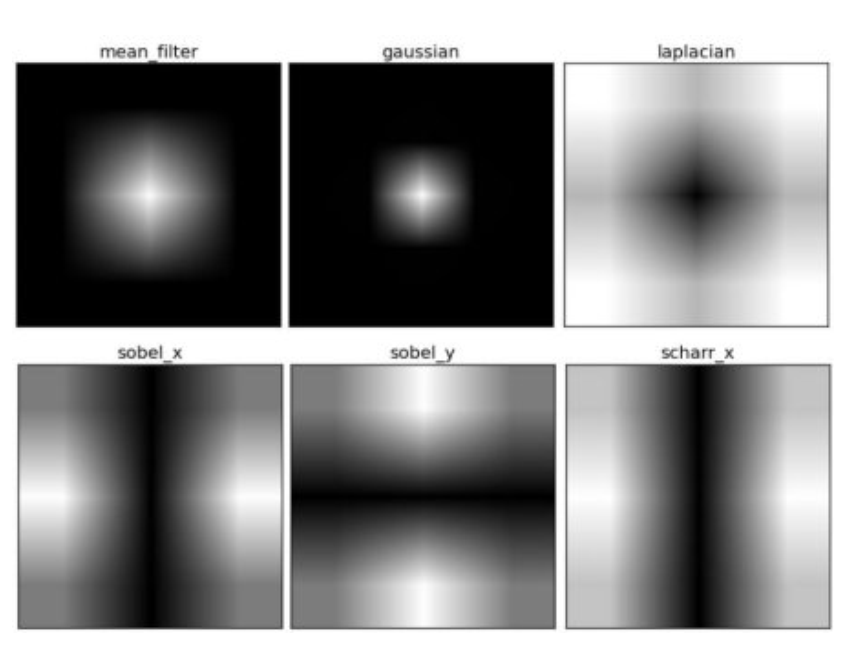
低频在中心,白色越多,频率内容越多。
一步,一步,一步...
回头看,已不见起点!

 浙公网安备 33010602011771号