Debugging Tips with Visual Studio 2010
http://weblogs.asp.net/scottgu/archive/2010/08/18/debugging-tips-with-visual-studio-2010.aspx
Debugging Tips with Visual Studio 2010
This is the twenty-sixth in a series of blog posts I’m doing on the VS 2010 and .NET 4 release.
Today’s blog post covers some useful debugging tips that you can use with Visual Studio. My friend Scott Cate (who has blogged dozens of great VS tips and tricks here) recently highlighted these to me as good tips that most developers using Visual Studio don’t seem to know about (even though most have been in the product for awhile). Hopefully this post will help you discover them if you aren’t already taking advantage of them. They are all easy to learn, and can help save you a bunch of time.
Run to Cursor (Ctrl + F10)
Often I see people debugging applications by hitting a breakpoint early in their application, and then repeatedly using F10/F11 to step through their code until they reach the actual location they really want to investigate. In some cases they are carefully observing each statement they step over along the way (in which case using F10/F11 makes sense). Often, though, people are just trying to quickly advance to the line of code they really care about – in which case using F10/F11 isn’t the best way to do this.
Instead, you might want to take advantage of the “run to cursor” feature that the debugger supports. Simply position your cursor on the line in your code that you want to run the application to, and then press the Ctrl + F10 keys together. This will run the application to that line location and then break into the debugger – saving you from having to make multiple F10/F11 keystrokes to get there. This works even if the line of code you want to run to is in a separate method or class from the one you are currently debugging.
Conditional Breakpoints
Another common thing we often see in usability studies are cases where developers set breakpoints, run the application, try out some input, hit a breakpoint, and manually check if some condition is true before deciding to investigate further. If the scenario doesn’t match what they are after, they press F5 to continue the app, try out some other input, and repeat the process manually.
Visual Studio’s conditional breakpoint capability provides a much, much easier way to handle this. Conditional breakpoints allow you to break in the debugger only if some specific condition that you specify is met. They help you avoid having to manually inspect/resume your application, and can make the whole debugging process a lot less manual and tedious.
How to Enable a Conditional Breakpoint
Setting up a conditional breakpoint is really easy. Press F9 in your code to set a breakpoint on a particular line:
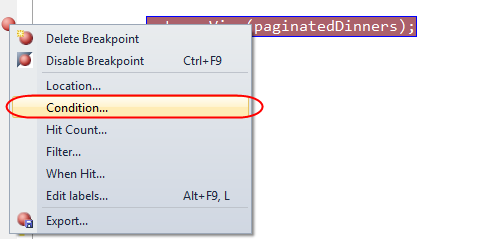
Then right-click on the breakpoint “red circle” on the left of the editor and select the “Condition…” context menu:
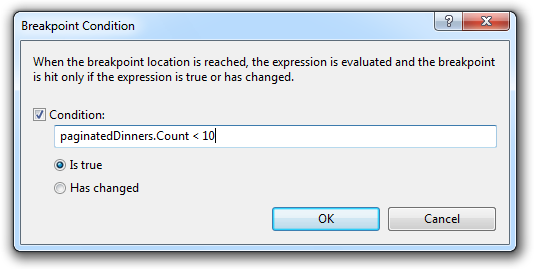
This will bring up a dialog that allows you indicate that the breakpoint should only be hit if some condition is true. For example, we could indicate that we only want to break in the debugger if the size of the local paginatedDinners list is less than 10 by writing the code expression below:
Now when I re-run the application and do a search, the debugger will only break if I perform a search that returns less than 10 dinners. If there are more than 10 dinners then the breakpoint won’t be hit.
Hit Count Feature
Sometimes you only want to break on a condition the Nth time it is true. For example: only break the 5th time less than 10 dinners is returned from a search.
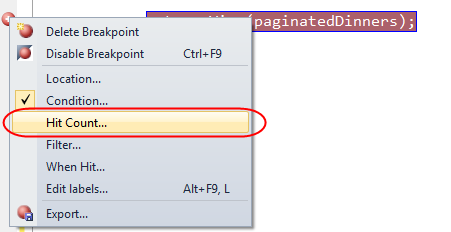
You can enable this by right-clicking on a breakpoint and selecting the “Hit count…” menu command.
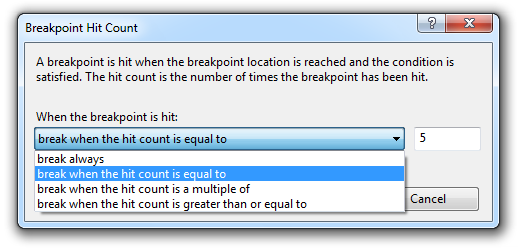
This will bring up a dialog that allows you to indicate that the breakpoint will only be hit the Nth time a condition is met, or every N times it is met, or every time after N occurrences:
Machine/Thread/Process Filtering
You can also right-click on a breakpoint and select the “Filter..” menu command to indicate that a breakpoint should only be hit if it occurs on a specific machine, or in a specific process, or on a specific thread.
TracePoints – Custom Actions When Hitting a BreakPoint
A debugging feature that a lot of people don’t know about is the ability to use TracePoints. A TracePoint is a breakpoint that has some custom action that triggers when the breakpoint is hit. This feature is particularly useful when you want to observe behavior within your application without breaking into the debugger.
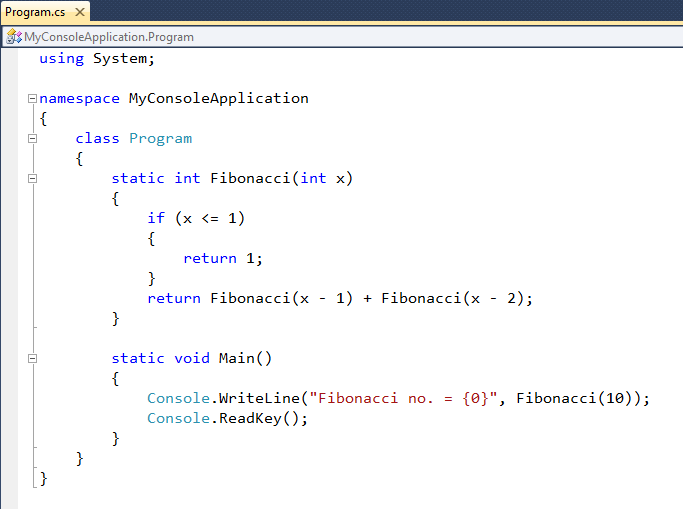
I’m going to use a simple Console application to demonstrate how we might be able to take advantage of TracePoints. Below is a recursive implementation of the Fibonacci sequence:
In the application above, we are using Console.WriteLine() to output the final Fibonacci sequence value for a specific input. What if we wanted to observe the Fibonacci recursive sequence in action along the way within the debugger – without actually pausing the execution of it? TracePoints can help us easily do this.
Setting up a TracePoint
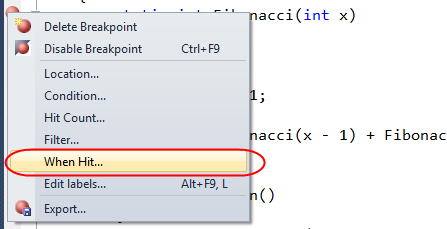
You can enable a TracePoint by using F9 to set a breakpoint on a line of code, and then right-click on the breakpoint and choose the “When Hit…” context menu command:
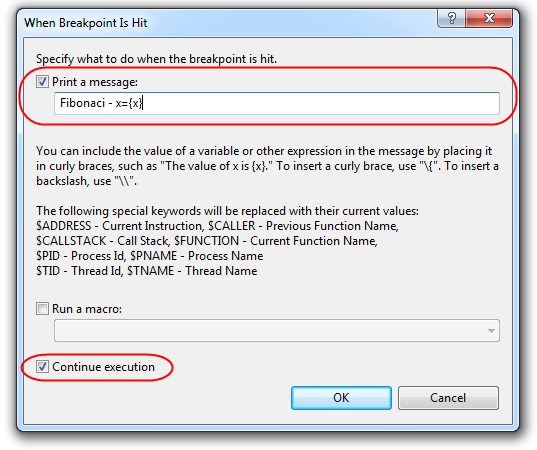
This will bring up the following dialog – which allows you to specify what should happen when the breakpoint is hit:
Above we’ve specified that we want to print a trace message anytime the breakpoint condition is met. Notice that we’ve specified that we want to output the value of the local variable “x” as part of the message. Local variables can be referenced using the {variableName} syntax. There are also built-in commands (like $CALLER, $CALLSTACK, $FUNCTION, etc) that can be used to output common values within your trace messages.
Above we’ve also checked the “continue execution” checkbox at the bottom – which indicates that we do not want the application to break in the debugger. Instead it will continue running – with the only difference being that our custom trace message will be output each time the breakpoint condition is met.
And now when we run the application, we’ll find that our custom trace messages automatically show up in the “output” window of Visual Studio – allowing us to follow the recursive behavior of the application:
You can alternatively wire-up a custom trace listener to your application - in which case the messages you print from your TracePoints will be piped to it instead of the VS output window.
TracePoints – Running a Custom Macro
In a talk I gave last week in London, someone in the audience asked whether it was possible to automatically output all of the local variables when a TracePoint was hit.
This capability isn’t built-in to Visual Studio – but can be enabled by writing a custom Macro in Visual Studio, and then wiring up a TracePoint to call the Macro when it is hit. To enable this, open up the Macros IDE within Visual Studio (Tools->Macros->Macros IDE menu command). Then under the MyMacros node in the project explorer, select a module or create a new one (for example: add one named “UsefulThings”). Then paste the following VB macro code into the module and save it:
Sub DumpLocals()
Dim outputWindow As EnvDTE.OutputWindow
outputWindow = DTE.Windows.Item(EnvDTE.Constants.vsWindowKindOutput).Object
Dim currentStackFrame As EnvDTE.StackFrame
currentStackFrame = DTE.Debugger.CurrentStackFrame
outputWindow.ActivePane.OutputString("*Dumping Local Variables*" + vbCrLf)
For Each exp As EnvDTE.Expression In currentStackFrame.Locals
outputWindow.ActivePane.OutputString(exp.Name + " = " + exp.Value.ToString() + vbCrLf)
Next
End Sub
The above macro code loops through the current stack frame and dumps all local variables to the output window.
Using our custom DumpLocals Custom Macro
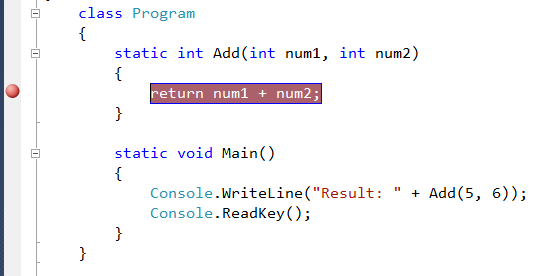
We can then take advantage of our custom “DumpLocals” macro using the simple addition application below:
We’ll use F9 to set a breakpoint on the return statement within our “Add” method above. We’ll then right-click on the breakpoint and select the “When hit” menu command:
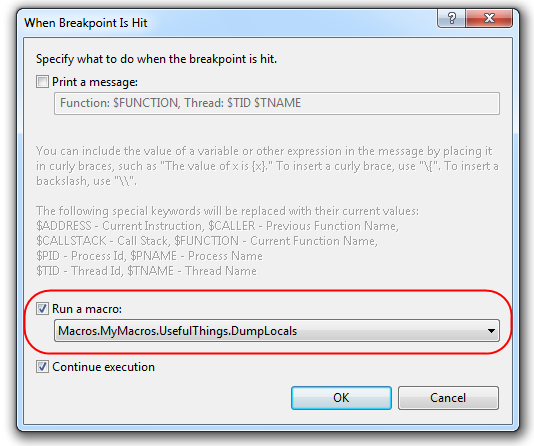
This will bring up the following dialog. Unlike before where we used the “Print a message” checkbox option and manually specified the variables we wanted to output, this time we’ll instead select the “Run a macro” checkbox and point to the custom UsefulThings.DumpLocals macro we created above:
We’ll keep the “continue execution” checkbox selected so that the program will continue running even when our TracePoints are hit.
Running the Application
And now when we press F5 and run the application, we’ll see the following output show up in the Visual Studio “output” window when our Add method is invoked. Note how the macro is automatically listing the name and value of each local variable when the TracePoint is hit:
Summary
The Visual Studio debugger is incredibly rich. I highly recommend setting aside some time to really learn all of its features. The above tips and tricks are but a few of the many features it provides that most people are actually unaware of.
I’ve previously blogged about other VS 2010 Debugger Improvements (including DataTip pinning, Import/Export of Breakpoints, Preserving Last Value Variables, and more). I’ll be doing more blog posts in the future about the new VS 2010 Intellitrace and Dump File Debugging support as well. These provide a bunch of additional cool new capabilities that can make debugging applications (including ones in production) a lot easier and more powerful.
Also make sure to check out Scott Cate’s excellent Visual Studio 2010 Tips and Tricks series to learn more about how to best take advantage of Visual Studio. He has an absolutely awesome set of free videos and blog posts.
And also check out Jim Griesmer’s great series on Visual Studio Debugging Trips and Tricks. He has a ton of good tips and tricks you can take advantage of.
Hope this helps,
Scott
P.S. In addition to blogging, I am also now using Twitter for quick updates and to share links. Follow me at: twitter.com/scottgu






 浙公网安备 33010602011771号