
matplotlib制图——子图-subplot及多图figure
import matplotlib.pyplot as plt
import numpy as np
import pandas as pd
x=np.arange(1,100)
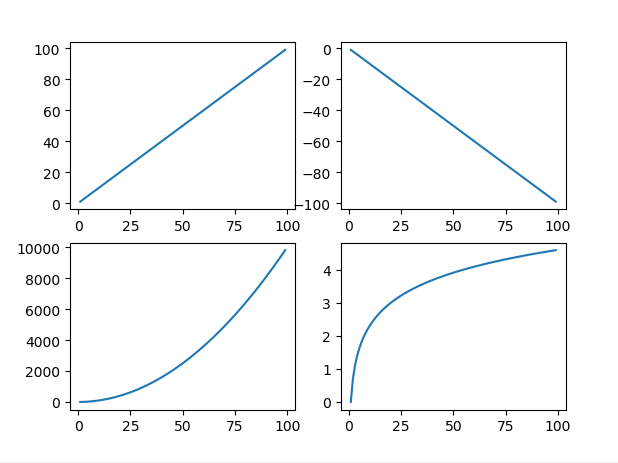
fig=plt.figure()
ax1=fig.add_subplot(221) #2*2的图形 在第一个位置
ax1.plot(x,x)
ax2=fig.add_subplot(222)
ax2.plot(x,-x)
ax3=fig.add_subplot(223)
ax3.plot(x,x**2)
ax3=fig.add_subplot(224)
ax3.plot(x,np.log(x))
plt.show()
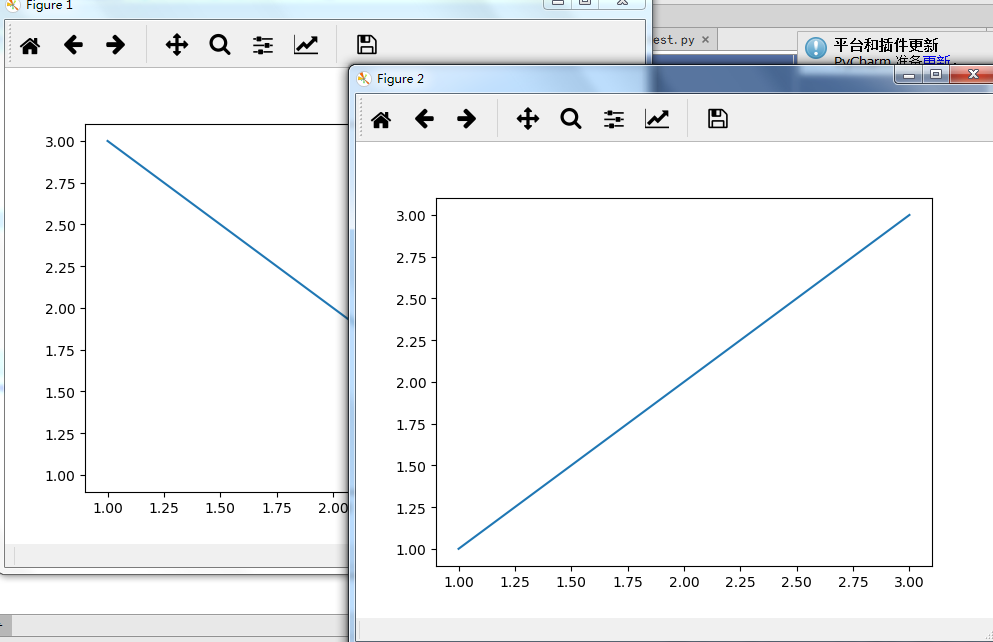
同时绘制两张图
import matplotlib.pyplot as plt
import numpy as np
import  pandas as pd
fig1=plt.figure()
ax1=fig1.add_subplot(111)
ax1.plot([1,2,3],[3,2,1])
fig2=plt.figure()
ax2=fig2.add_subplot(111)
ax2.plot([1,2,3],[1,2,3])
plt.show()
posted on 2017-12-16 21:06 alimin1987 阅读(10301) 评论(0) 编辑 收藏 举报

