

matplotlib制图——条形图
条形图_一组数据
import numpy as np
import  pandas as pd
import matplotlib.pyplot as plt
N=5
y=[20,10,30,25,15]
index = np.arange(N)
#p1=plt.bar(index,y,width=0.5,color='b') #条形图 left昨天横坐标 高度height color为颜色,width为宽度 垂直
plt.barh(index,y,width=0.5,color='b')#s水平直方图
p1=plt.barh(
plt.show()
条形图_两组数据
import numpy as np
import  pandas as pd
import matplotlib.pyplot as plt
index = np.arange(4)
sales_BJ=[52,55,63,53]
sales_SH=[44,66,55,41]
bar_width=0.3
plt.bar(index,sales_BJ,bar_width,color='b') #sales_BJ直方图
plt.bar(index+bar_width,sales_SH,bar_width,color='r') #叠加sales_SH的直方图(主要是加一个bar_width)图1
#
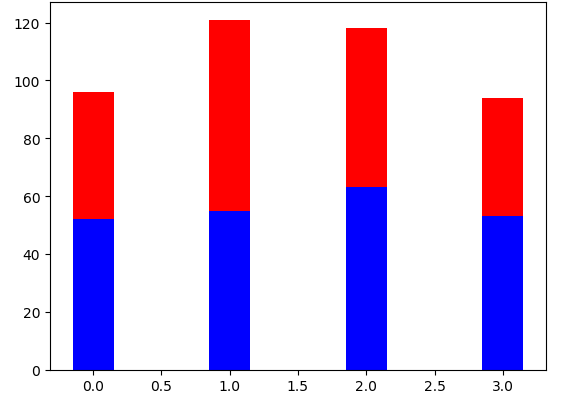
plt.bar(index,sales_SH,bar_width,color='r',bottom=sales_BJ) #叠加sales_SH的层叠图 图2
plt.show()

图1
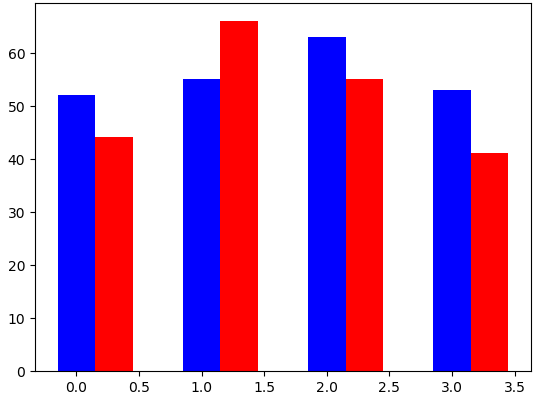
图2
posted on 2017-12-16 18:13 alimin1987 阅读(3239) 评论(0) 编辑 收藏 举报
