LIBS(1-数据的展示)
LIBS-数据的展示
libs中需要将数据给展示出来,
一开始打算自己写一个数据绘制的控件,参考了b站的视频WPF 图表控件库 WindChart 3_哔哩哔哩_bilibili
但在此遇到一个问题,在计算像素比的时候RenderSize这个属性在一些情况下为0,也始终找不到方法规避,于是换了微软的chart框架。同时找了篇文章做参考
Chart 类 (System.Windows.Forms.DataVisualization.Charting) | Microsoft Learn
WPF调用Winform Chart控件绘图 - StackMiao - 博客园 (cnblogs.com)
通过以上这两个资料,我们可以得出,在WPF中使用此框架绘制,需要在容器绘制,而绘制需要注意3个类,
- Series:控制绘图的类型和数据的注入
- ChartAreas :控制XY轴的样式
- Legends :图表图像的图例
将这三个类初始画赋值,添加到容器中就可以完成图标的绘制。
1.框架的引入
在程序集中添加
- System.Windows.Forms;
- System.Windows,Forms.DataVisualization;
- WindowsFormsIntefration;
2.容器的添加
在XMAL中添加命名空间
xmlns:Wchart="clr-namespace:System.Windows.Forms.DataVisualization.Charting;assembly=System.Windows.Forms.DataVisualization"
引入容器,给容器一个名字
<WindowsFormsHost>
    <Wchart:Chart x:Name="ChartPlot"/>
 </WindowsFormsHost>
3.3种类的初始化和赋值
- 初始化三个类ChartArea,Series,Legend,我是为了方便调用,设置为了类的属性
- 对其的属性根据需要赋值。具体属性所代表的意义可以看微软官方文档
- 在容器中注入值,一个容器中可以注入多个Series类,所以在一个容器中可以显示多张图表。
public class OneChart
    {
        public OneChart()
        {
            chartAreaLine = new ChartArea();
            series = new Series();
            legend = new Legend();
            xYpointList = new List<XYpoint>();

            Init();

        }


        public ChartArea chartAreaLine { get; set; }
        public Series series { get; set; }
        public Legend legend { get; set; }


        private List<XYpoint> xYpointList;

        public List<XYpoint> XYpointList
        {
            get { return xYpointList; }
            set { xYpointList = value; DataChanged(); }
        }

        public string xTitle { get; set; } = "X轴";

        public string yTitle { get; set; } = "Y轴";

        public string LineTitle { get; set; } = "线条1";


        private void Init()
        {
            chartAreaLine.AxisX.Title = xTitle;
            chartAreaLine.AxisX.TitleAlignment = System.Drawing.StringAlignment.Far; // 标题对其方式

            chartAreaLine.AxisX.IntervalAutoMode = IntervalAutoMode.FixedCount; // 间隔的模式
            //chartAreaLine.AxisX.Interval = 2; // 轴的间隔
            chartAreaLine.AxisX.IntervalType = DateTimeIntervalType.Auto; // 轴的间隔单位类型,默认为auto

            chartAreaLine.AxisX.Minimum = 0; // 轴的起始点,最小值

            chartAreaLine.AxisX.ArrowStyle = AxisArrowStyle.Lines; // 箭头
            chartAreaLine.AxisX.MajorGrid.Enabled = false;  // 是否启用网格线

            chartAreaLine.AxisY.Title = yTitle;
            chartAreaLine.AxisY.IntervalType = DateTimeIntervalType.Auto;
            chartAreaLine.AxisY.ArrowStyle = AxisArrowStyle.Lines; // 箭头
            chartAreaLine.AxisY.TitleAlignment = System.Drawing.StringAlignment.Far;


            series.ChartType = SeriesChartType.Line; // 绘图类型
            series.Color = System.Drawing.Color.Red;
            series.Name = LineTitle;

            legend.Alignment = System.Drawing.StringAlignment.Near;
            legend.Docking = Docking.Right;
            legend.IsDockedInsideChartArea = true;
            legend.BackColor = System.Drawing.Color.Transparent;

        }

        public void DataChanged()
        {
            series.Points.Clear();
            foreach (var item in xYpointList)
            {
                series.Points.AddXY(item.X, item.Y);
            }
        }
    }

    public class XYpoint
    {
        public XYpoint(double x, double y)
        {
            X = x;
            Y = y;
        }
        public double X { get; set; }
        public double Y { get; set; }
    }

 public partial class MainWindow : Window
    {

        public MainWindow()
        {
            InitializeComponent();

            // 1.通过引用dll文件编写方法获取机器数据
           // GetData();

            // 2.处理数据
           // DealData();

            // 3.展示数据
            DisPlayData();

        }

        #region 成员变量


        // 初始化图标
        OneChart oneChart = new OneChart();
        #endregion

        #region 方法
        /// <summary>
        /// 展示数据
        /// </summary>
        public void DisPlayData()
        {

            // 给数据
            Random random = new Random();
            List<XYpoint> xYpoints = new List<XYpoint>();
            for (int i = 0; i < 500; i++)
            {
                xYpoints.Add(new XYpoint(i, random.Next(10, 40)));
            }
            oneChart.XYpointList = xYpoints;


            // 关联
            ChartPlot.Series.Add(oneChart.series);
            ChartPlot.ChartAreas.Add(oneChart.chartAreaLine);
            ChartPlot.Legends.Add(oneChart.legend);
        }

        #endregion

        public void ChangeDateRandom()
        {
            this.Dispatcher.Invoke(() =>
            {

                Random random = new Random();
                List<XYpoint> xYpoints = new List<XYpoint>();
                for (int i = 0; i < 500; i++)
                {
                    xYpoints.Add(new XYpoint(i, random.Next(10, 40)));
                }
                oneChart.XYpointList = xYpoints;

            });
        }
    }
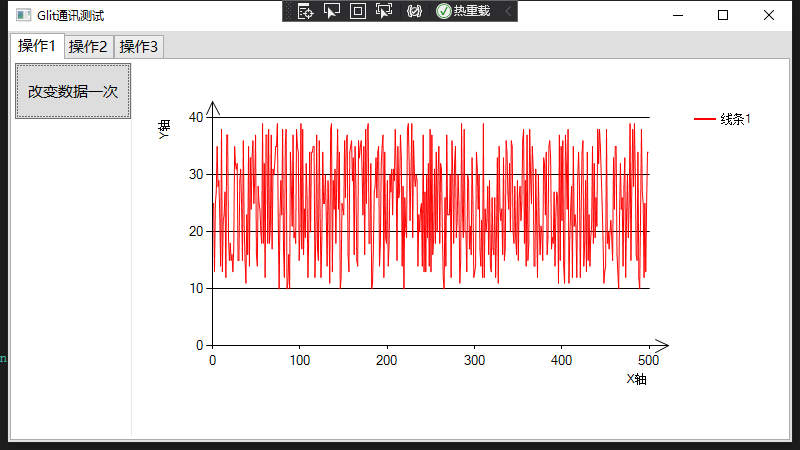
最后做出来的效果如图