06 - matplotlib
matplotlib
介绍
In [20]: plt.plot? # 帮助文档
Signature: plt.plot(*args, **kwargs)
Docstring:
Plot y versus x as lines and/or markers.
Call signatures::
plot([x], y, [fmt], data=None, **kwargs)
plot([x], y, [fmt], [x2], y2, [fmt2], ..., **kwargs)
The coordinates of the points or line nodes are given by *x*, *y*.
The optional parameter *fmt* is a convenient way for defining basic
formatting like color, marker and linestyle. It's a shortcut string
notation described in the *Notes* section below.
>>> plot(x, y) # plot x and y using default line style and color
>>> plot(x, y, 'bo') # plot x and y using blue circle markers
>>> plot(y) # plot y using x as index array 0..N-1
>>> plot(y, 'r+') # ditto, but with red plusses
You can use `.Line2D` properties as keyword arguments for more
control on the appearance. Line properties and *fmt* can be mixed.
The following two calls yield identical results:
>>> plot(x, y, 'go--', linewidth=2, markersize=12)
>>> plot(x, y, color='green', marker='o', linestyle='dashed',
linewidth=2, markersize=12)
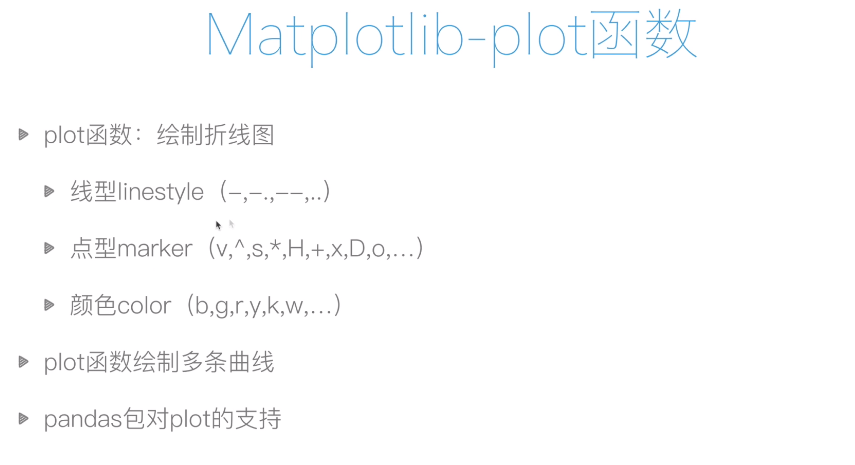
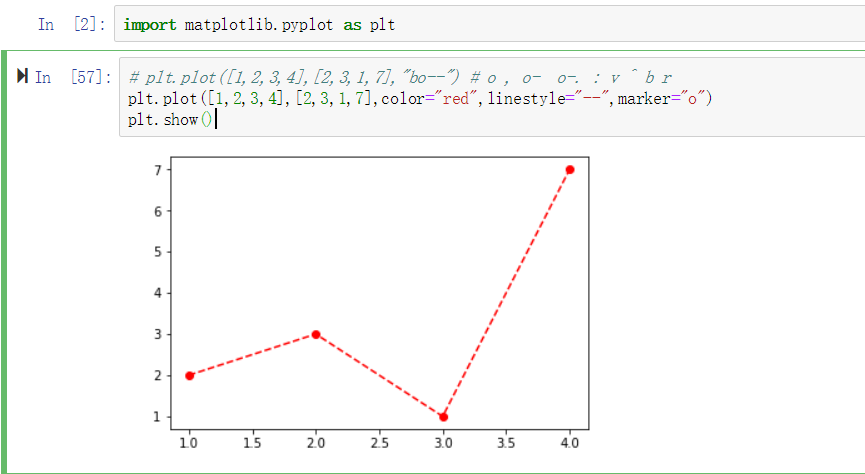
plot函数
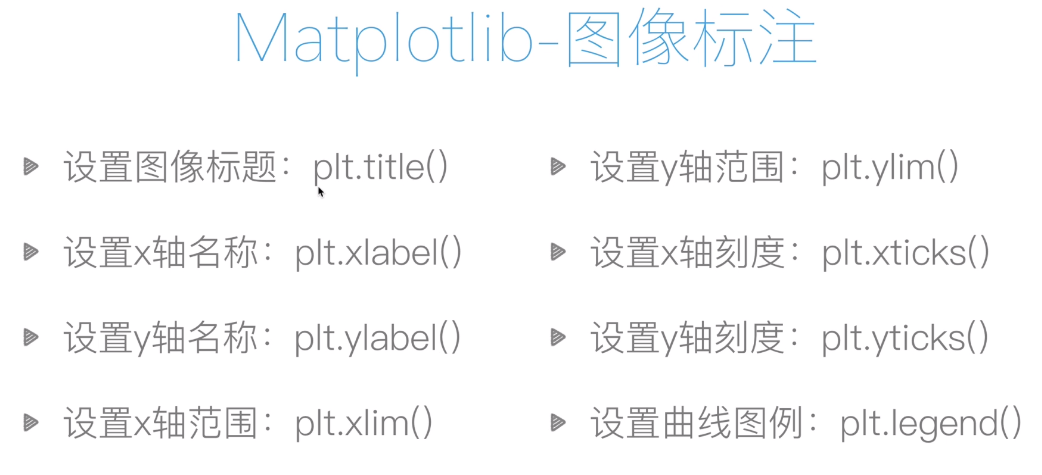
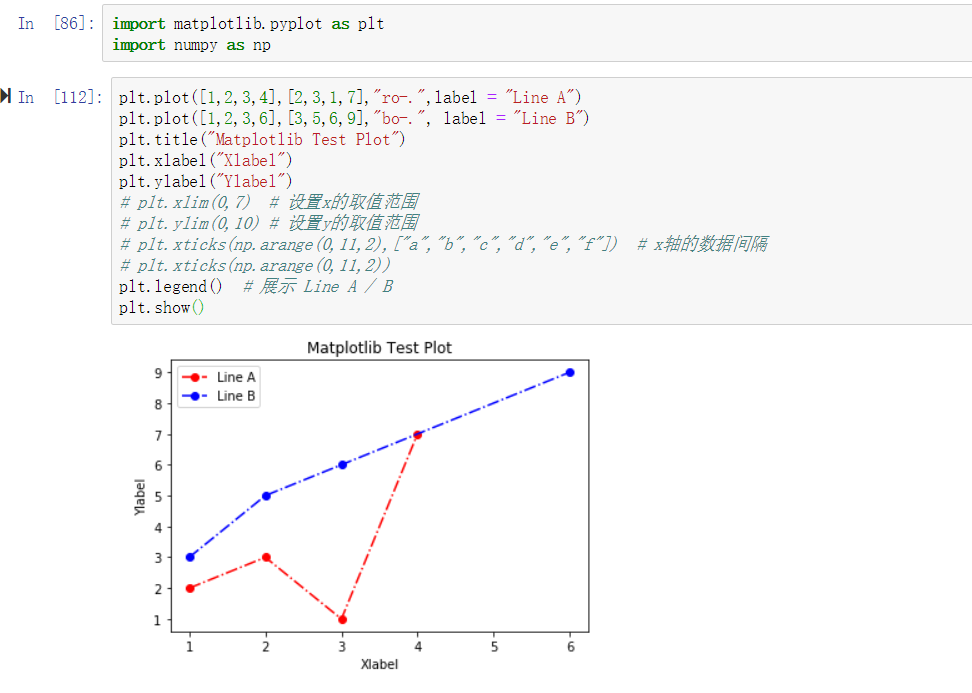
图像标注
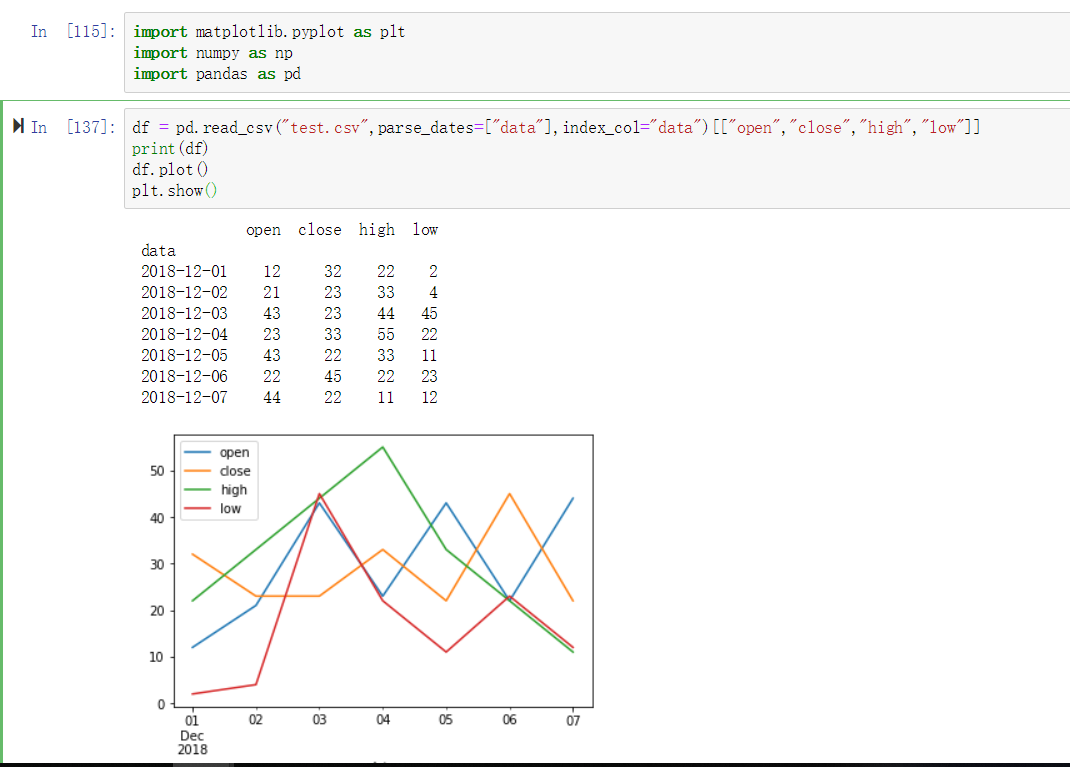
matplotlib 与 pandas 的关联,之以直接绘图;df.plot()
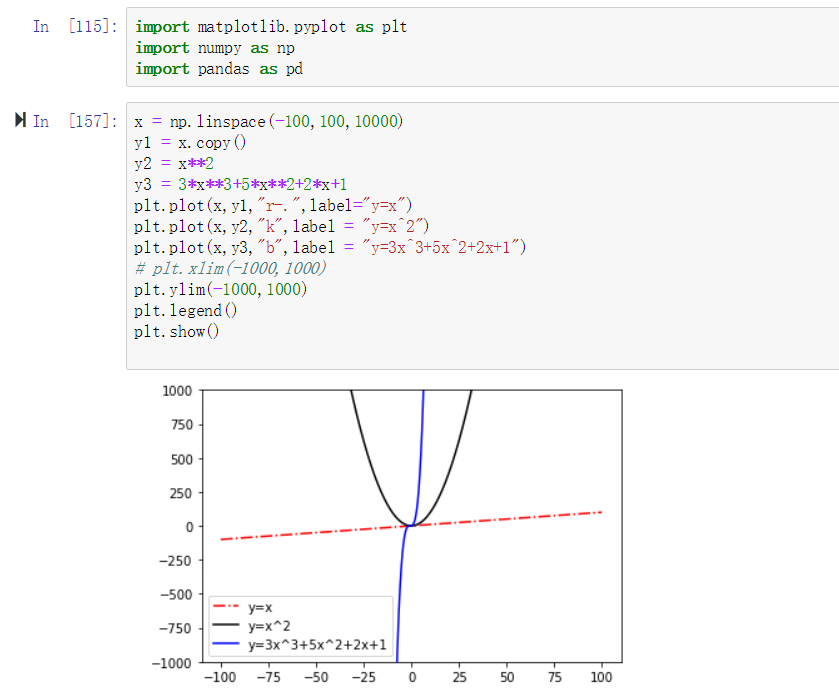
绘制数学函数图像
练习:

y = x
y = x^2
y = 3x^3 + 5x^2 + 2x + 1
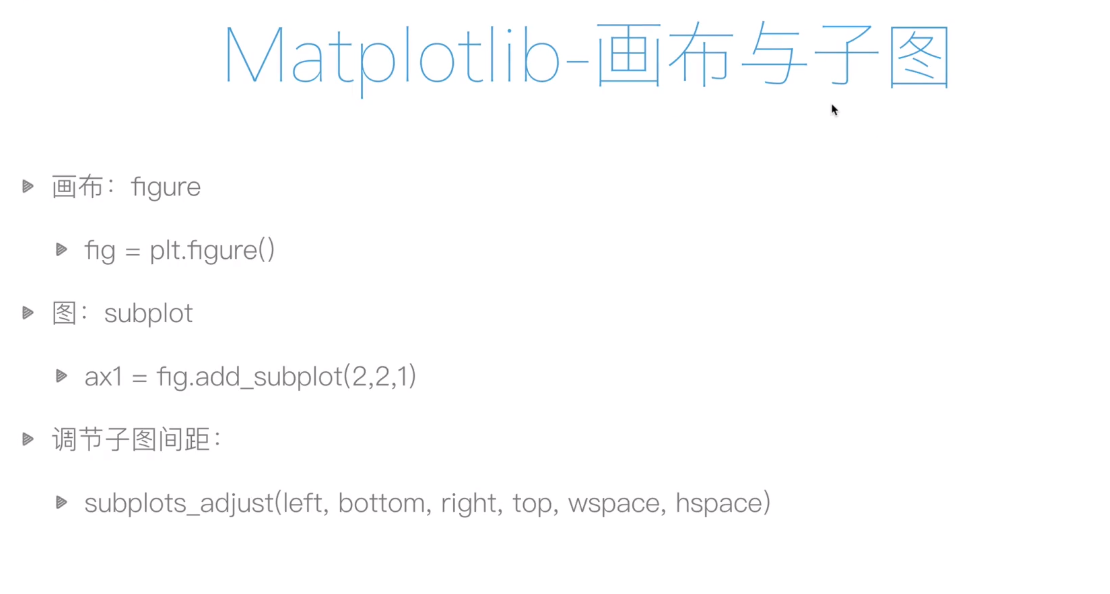
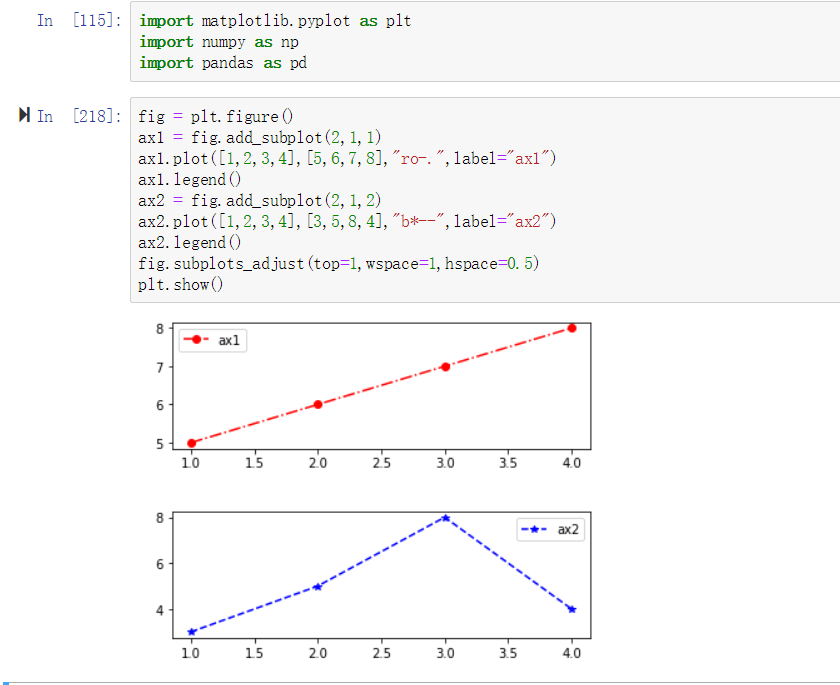
画布与子图
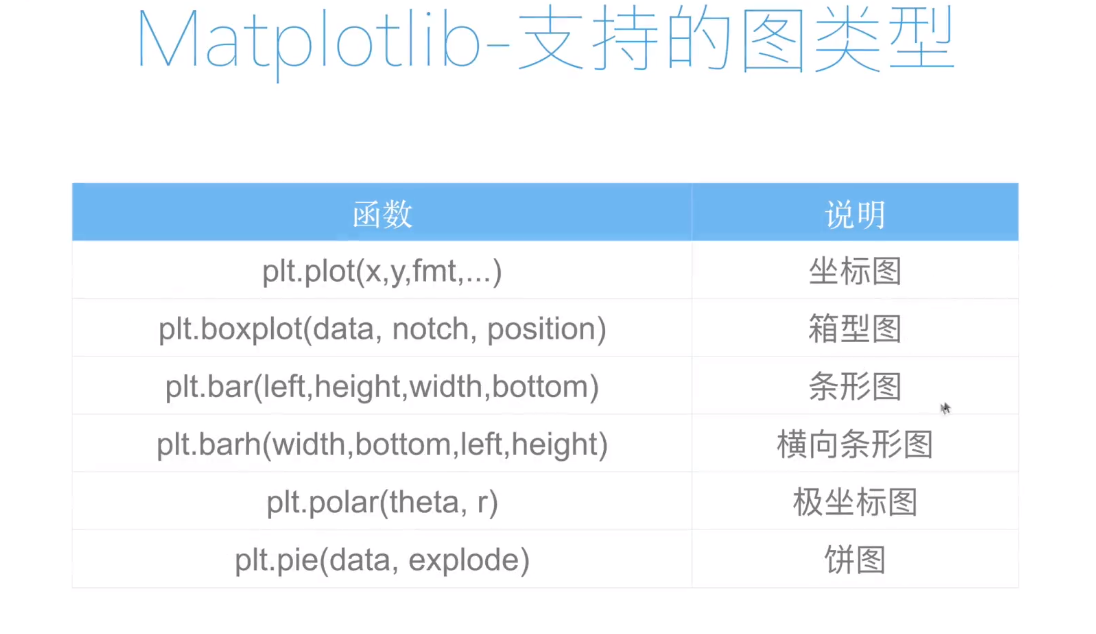
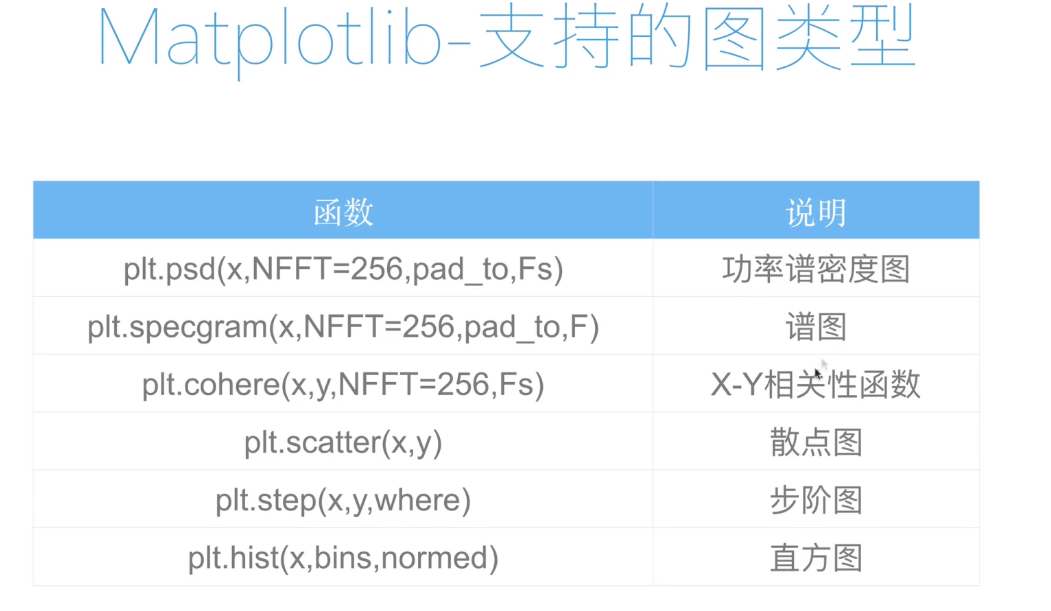
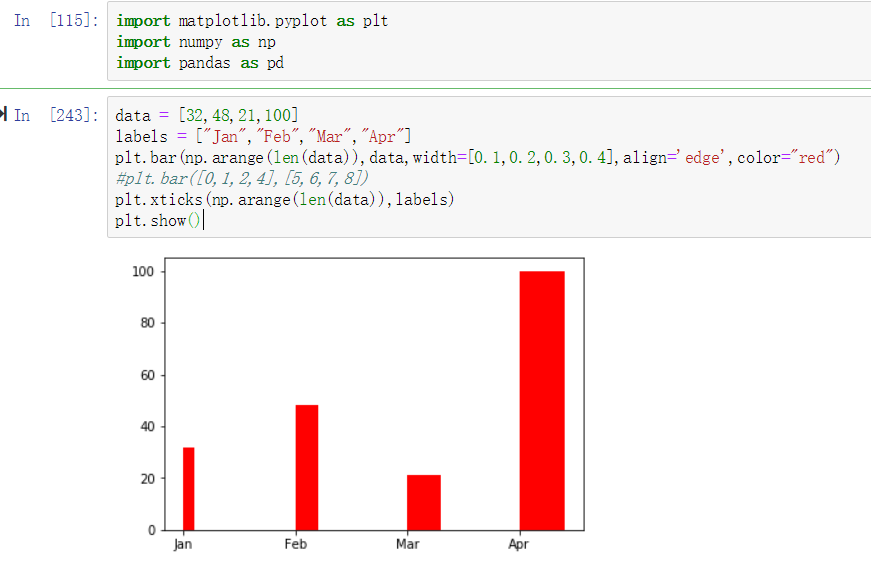
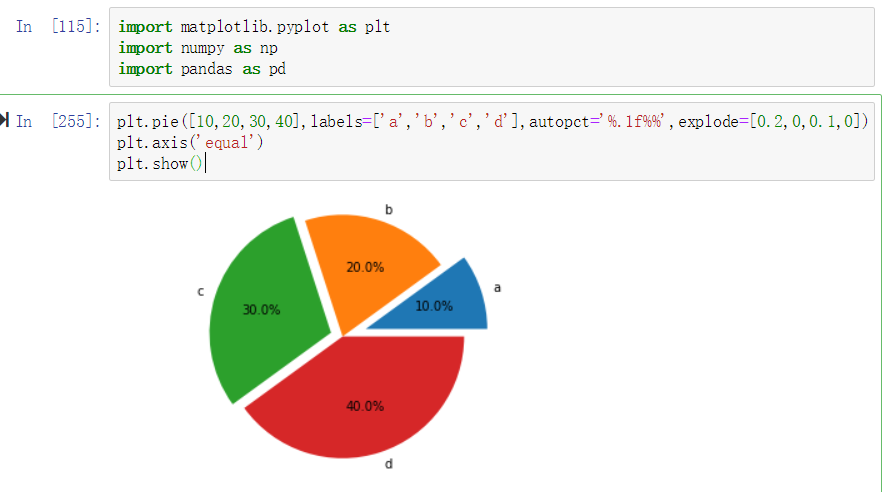
支持的图类型
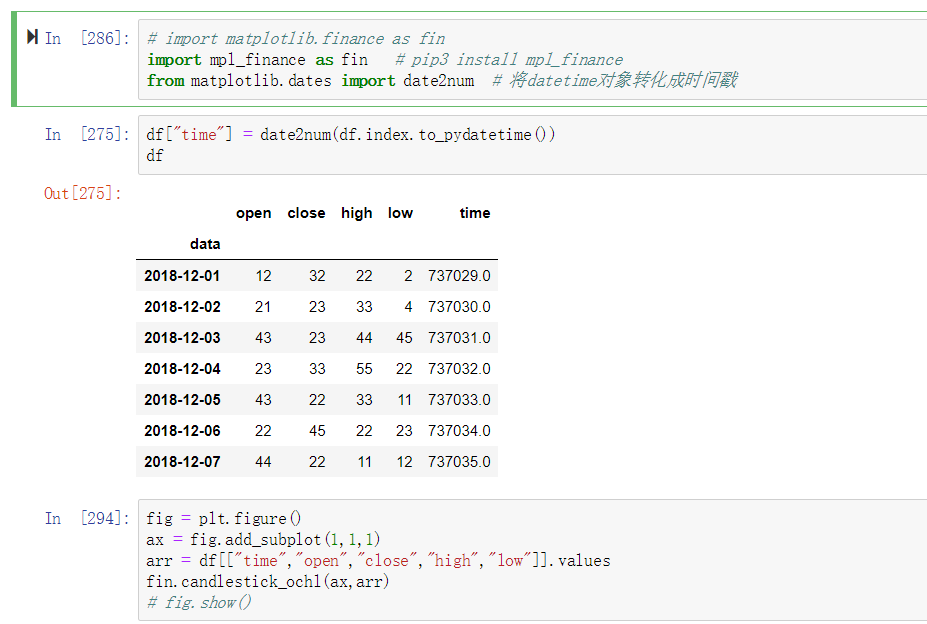
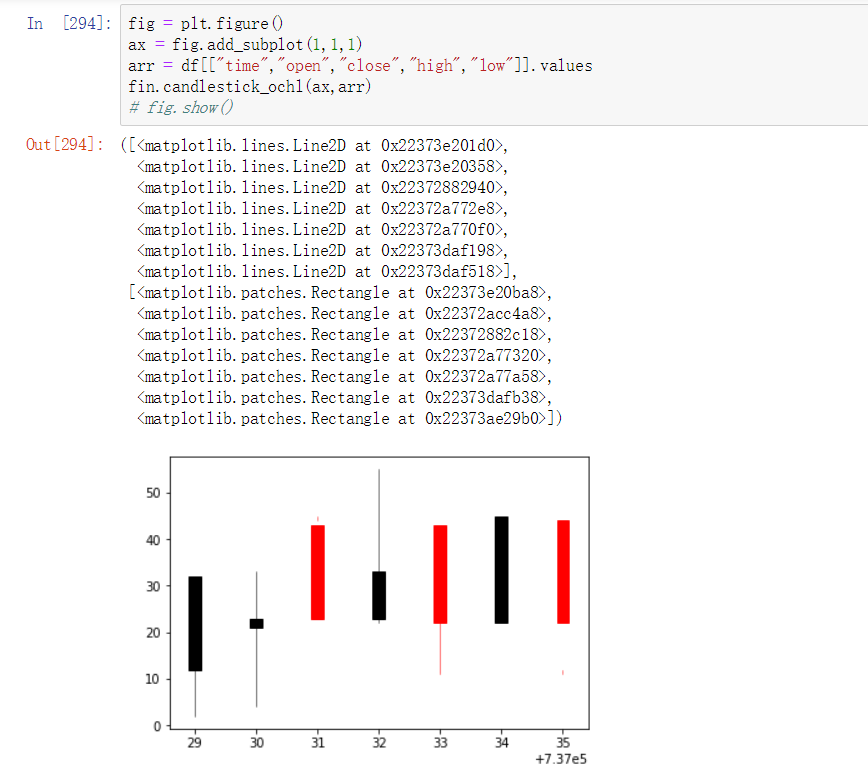
绘制K线图


 浙公网安备 33010602011771号