
【796】Confusion Matrix 混淆矩阵相关
参考:sklearn.metrics.confusion_matrix
参考:Matplotlib setting title bold while using "Times New Roman"
参考:Choosing Colormaps in Matplotlib(colorbar关键字)
一、创建 Confusion Matrix (方法一)
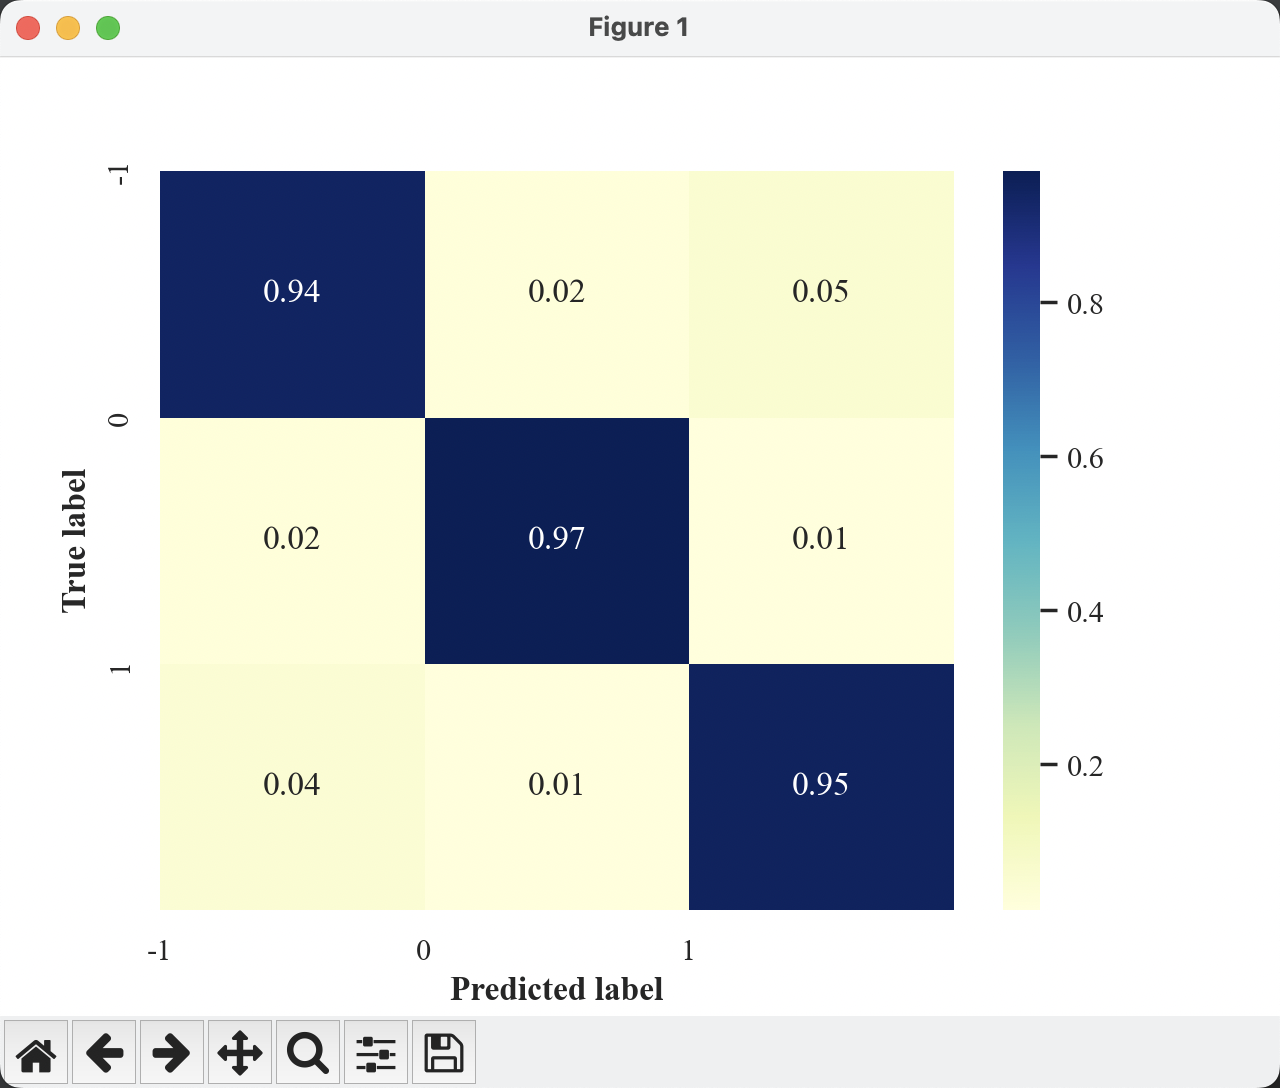
import numpy as np import seaborn as sns from sklearn.metrics import confusion_matrix import matplotlib.pyplot as plt # 两个数组存储在npy文件中了,下面为读取 y_true = list(np.load('y_true.npy')) y_pred = list(np.load('y_pred.npy')) # 计算混淆矩阵数量 C2 = confusion_matrix(y_true, y_pred, labels=[0, 1, 2]) # 计算百分比 C2_normal = np.round(C2/np.sum(C2, axis=1).reshape(-1, 1), 2) sns.set() sns.heatmap(C2_normal, cmap="YlGnBu", annot=True) # 设置全局字体 plt.rcParams['font.sans-serif'] = 'Times New Roman' # 设置x轴y轴的显示内容,并加粗 plt.xlabel("Predicted label", fontweight='bold') plt.ylabel('True label', fontweight='bold') # 设置x轴y轴的显示刻度 plt.xticks([0, 1, 2], [-1, 0, 1]) plt.yticks([0, 1, 2], [-1, 0, 1]) # 图像显示 #plt.show() # 图像存储,PDF为矢量图 plt.savefig("Confusion_matrix.pdf")
效果:
通过 Adobe Acrobat 调整标签位置
参考:How to Plot Confusion Matrix Heatmap in Python
参考:Python中生成并绘制混淆矩阵(confusion matrix)
参考:How to format xticklabels in a confusion matrix plotted with scikit-learn / matplotlib?
二、创建 Confusion Matrix (方法二)
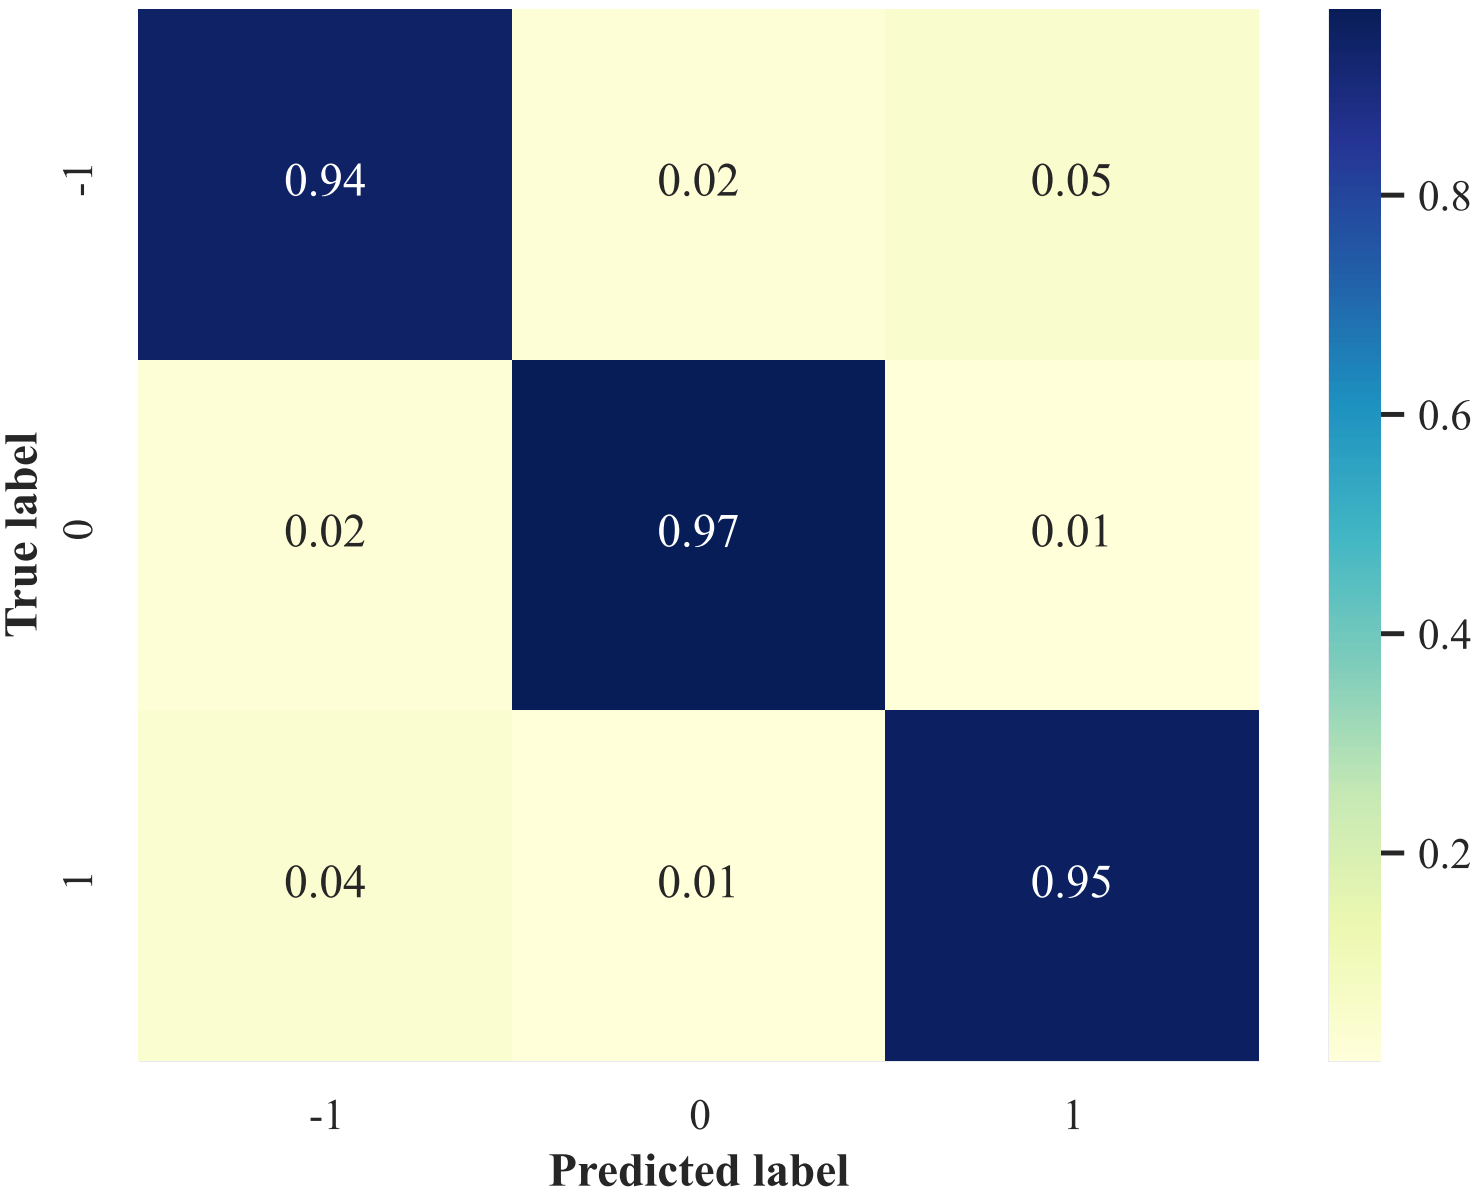
import seaborn as sns from sklearn.metrics import confusion_matrix import matplotlib.pyplot as plt # 两个数组存储在npy文件中了,下面为读取 y_true = list(np.load('y_true.npy')) y_pred = list(np.load('y_pred.npy')) # 计算混淆矩阵数量 C2 = confusion_matrix(y_true, y_pred, labels=[0, 1, 2]) # 计算百分比 C2_normal = np.round(C2/np.sum(C2, axis=1).reshape(-1, 1), 2) sns.set() f, ax = plt.subplots() sns.heatmap(C2_normal, cmap="YlGnBu", annot=True, ax=ax) # heatmap #ax.set_title('Normalized confusion maxtrix') # title ax.set_xlabel('Predicted label') ax.set_ylabel('True label') ax.xaxis.set_ticklabels([-1, 0, 1]) ax.yaxis.set_ticklabels([-1, 0, 1])
效果:
参考:python画混淆矩阵(confusion matrix)
三、设置 matplotlib.pyplot 全局字体
import matplotlib.pyplot as plt plt.rcParams['font.sans-serif'] = 'Times New Roman'


【推荐】国内首个AI IDE,深度理解中文开发场景,立即下载体验Trae
【推荐】编程新体验,更懂你的AI,立即体验豆包MarsCode编程助手
【推荐】抖音旗下AI助手豆包,你的智能百科全书,全免费不限次数
【推荐】轻量又高性能的 SSH 工具 IShell:AI 加持,快人一步
· 全程不用写代码,我用AI程序员写了一个飞机大战
· DeepSeek 开源周回顾「GitHub 热点速览」
· 记一次.NET内存居高不下排查解决与启示
· MongoDB 8.0这个新功能碉堡了,比商业数据库还牛
· .NET10 - 预览版1新功能体验(一)