认识matplotlib的figure
1、figure对象
-
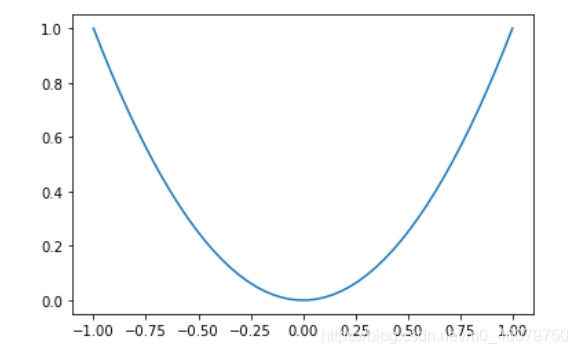
获取数据
x=np.linspace(-1,1,50) y1 = x**2 y2 = x**3 -
设置两个figure
plt.figure() #……………………(绘图代码) plt.figure() #……………………(绘图代码) -
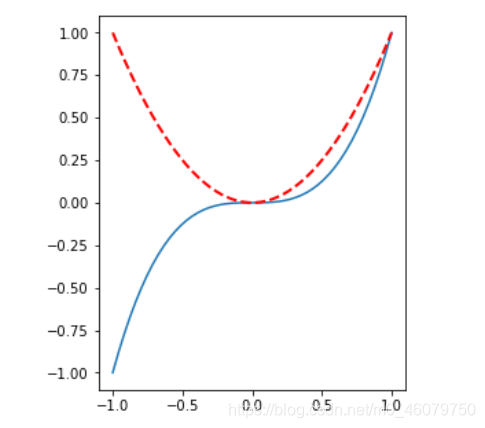
figure对象名称、尺寸设置
plt.figure(num=4,figsize=(4,5)) -
图像颜色、线宽、样式设置
plt.plot(x,y1,color='red',linewidth=2.0,linestyle='--') -
整体代码
import matplotlib.pyplot as plt
import numpy as np

#figure对象

x=np.linspace(-1,1,50)
y1 = x**2
y2 = x**3

# 设置两个figure
plt.figure()
plt.plot(x,y1)

plt.figure(num=4,figsize=(4,5))  # figure对象名称、尺寸设置
plt.plot(x,y2)
plt.plot(x,y1,color='red',linewidth=2.0,linestyle='--')  #图像颜色、线宽、样式设置

plt.show()
本文来自博客园,作者:aJream,转载请记得标明出处:https://www.cnblogs.com/ajream/p/15383625.html

 浙公网安备 33010602011771号