matplotlib坐标轴设置-2
坐标轴位置挪动
-
获取轴边框
ax = plt.gca() -
删除右边、上边的边框
ax.spines['right'].set_color('none')
ax.spines['top'].set_color('none')
-
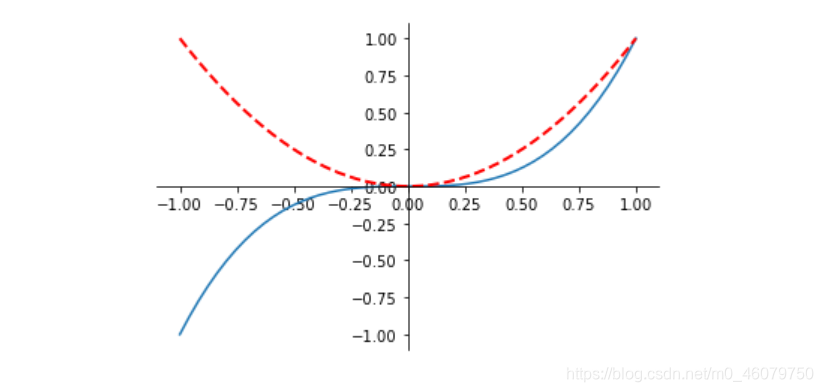
设置x ,y 轴位置:如
ax.spines['bottom'].set_position(('data', y0)),参数为 元组ax.spines['bottom'].set_position(('data', y0)) # x轴与y轴为y0的位置相交 ax.spines['left'].set_position(('data', x0)) # y轴与x轴为x0的位置相交 #两者合一表示x,y轴交于(x0,y0)点
-
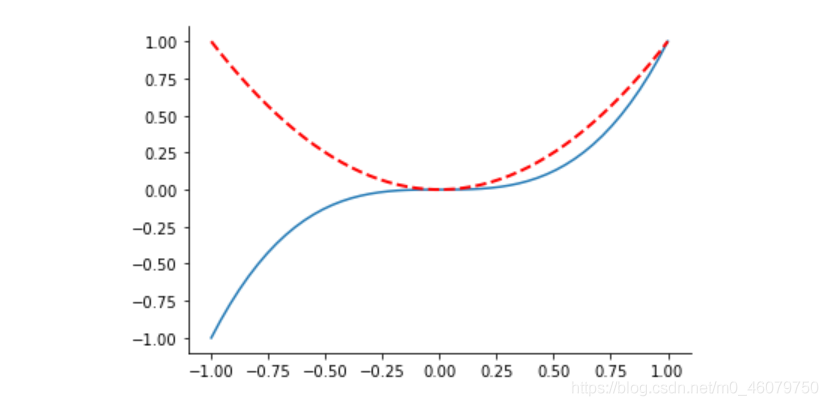
完整代码
import matplotlib.pyplot as plt
import numpy as np
x=np.linspace(-1,1,50)
y1 = x**2
y2 = x**3
plt.figure(num=4)  # figure对象名称、尺寸设置
plt.plot(x,y2)
plt.plot(x,y1,color='red',linewidth=2.0,linestyle='--')

#获取轴边框
ax = plt.gca()
print(ax)

# ax.xaxis.tick_bottom()

ax.spines['right'].set_color('none')
ax.spines['top'].set_color('none')

ax.spines['bottom'].set_position(('data', 0))
ax.spines['left'].set_position(('data', 0))
本文来自博客园,作者:aJream,转载请记得标明出处:https://www.cnblogs.com/ajream/p/15383621.html

 浙公网安备 33010602011771号