matplotlib绘制柱状图
柱状图
plt.bar(x, height, color,edgecolor,width=0.8,align='center',bottom=None)
必选参数:
- x,表示横坐标刻度值,可以是array、list等
- height,表示每个柱子的高度,可以是array、list等
可选参数:
-
color:每个柱子的颜色,如果所有柱子的颜色都一样,可以只设置一种颜色,如
color='blue';但如果每个柱子都想要不同的颜色,用列表表示每个柱子的颜色。例如:#假设有三个柱子 x = [1,2,3] height = [4,5,6] plt.bar(x, height, color=['r','g','b']) #三个柱子颜色分别为红、绿、蓝 plt.show()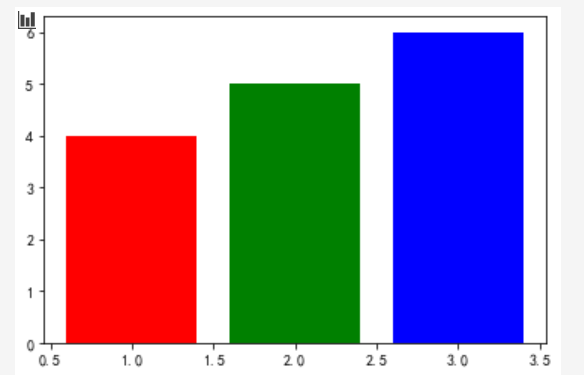
-
edgecolor:柱子边缘颜色,用法与color一样。
例如:
plt.bar(x,height,color='white',edgecolor='black')
plt.show()
-
width:表示每个柱子的宽度,默认是0.8
-
align:表示柱子中间的位置,默认为
center,表示柱子的中间位置与x轴的刻度对齐。还可以选用edge, 表示柱子的左边缘与x轴的刻度对齐。如:x = [1,2,3] height = [4,5,6] plt.bar(x,height,color='b',width=0.3, align='edge') #左边缘对齐刻度,柱子宽0.3 plt.xticks(x) # 标x轴刻度 plt.show()
通过调整x的值和 width 可以做出下面的图:
x1 = np.array([1,2,3])
y1 = [4,2,6]
y2 = [3,8,4]

plt.bar(x1-0.15, y1,width=0.3,align='center',alpha=0.5)
plt.bar(x1+0.15,y2,width=0.3,color='g',align='center',alpha=0.5)

plt.xticks(x1,['s1','s2','s3'],fontsize=15)         #把x轴刻度用字符代替
plt.yticks([1,3,5,7],['a','b','c','d'],fontsize=10)
plt.show()

-
bottom:表示每个柱子底部的y轴坐标,可以是单个数,也可以是list, array等
例如:
x = [1,2,3]
height = [4,5,6]

plt.bar(x,height,color='b',bottom=2)
plt.xticks(x)
plt.show()
注意底部 y 轴坐标,顶部y轴坐标为:
top = bootom + height
x = [1,2,3]
height = [4,5,6]

plt.bar(x,height,color='b',bottom=[0,1,2]) # bottom使用列表
plt.xticks(x)
plt.show()
使用 bottom参数可以绘制堆叠图:
例如:
#假设有三个柱子
x = [1,2,3]
height_1 = [4,5,6]
height_2 = [7,4,2]

plt.bar(x,height_1,color='b')
plt.bar(x,height_2,color='r',bottom=[4,5,6])
plt.xticks(x)
plt.show()

用 plt.text(x,y,s)可以给每个柱子都标上说明
- x, y 表示说明文字 s 的坐标位置
现在在每个柱子上标上它们的 y轴位置
#假设有三个柱子
x = [1,2,3]
height_1 = np.array([4,5,6])
height_2 = np.array([7,4,2])

plt.bar(x,height_1,color='b')
plt.bar(x,height_2,color='r',bottom=height_1)
plt.xticks(x)

for x1,y1 in zip(x,height_1):
    plt.text(x1,y1,y1,fontsize=15) 			#说明文字是y1

for x2,y2 in zip(x,height_1+height_2):
    plt.text(x2,y2,y2,fontsize=12)          #说明文字是y2
plt.show()

图画的有点难看!!!
最后放一张matplotlib颜色表:
本文来自博客园,作者:aJream,转载请记得标明出处:https://www.cnblogs.com/ajream/p/15383584.html

 浙公网安备 33010602011771号