前面我们介绍到,Path对象表示一个用直线或者曲线连接的图形,我们可以使用Path.Data属性来设置该图形的形状,同时我们也可以使用Data.Fill属性来设置该图形中的填充色或背景图片等。
下面我们先来看一段代码
<Window x:Class="WPF.SimpleGraph.PathFill.Window1"
xmlns="http://schemas.microsoft.com/winfx/2006/xaml/presentation"
xmlns:x="http://schemas.microsoft.com/winfx/2006/xaml"
Title="Window1" Height="300" Width="300">
<Canvas>
<Path Stroke="DarkGray" StrokeThickness="2">
<Path.Data>
<PathGeometry>
<PathFigure StartPoint="40,40" IsClosed="True">
<LineSegment Point="40,130"></LineSegment>
<ArcSegment Point="60,150" Size="20,20" ></ArcSegment>
<LineSegment Point="200,150"></LineSegment>
<ArcSegment Point="220,130" Size="20,20"></ArcSegment>
<LineSegment Point="220,40"></LineSegment>
<ArcSegment Point="200,20" Size="20,20"></ArcSegment>
<LineSegment Point="60,20"></LineSegment>
<ArcSegment Point="40,40" Size="20,20"></ArcSegment>
</PathFigure>
</PathGeometry>
</Path.Data>
<Path.Fill>
<LinearGradientBrush StartPoint="0,0" EndPoint="1,1">
<GradientStop Color="White" Offset="0.25"></GradientStop>
<GradientStop Color="LightBlue" Offset="0.5"></GradientStop>
<GradientStop Color="Blue" Offset="0.75"></GradientStop>
<GradientStop Color="DarkBlue" Offset="1"></GradientStop>
</LinearGradientBrush>
</Path.Fill>
</Path>
</Canvas>
</Window>
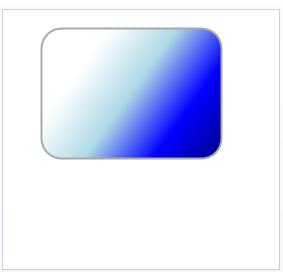
它的执行结果是:
下面我们来分析一下该图形的产生原理
首先,我们通过Path.Data来绘制了一个弧形角的矩形
然后,使用Path.Fill来向该矩形中填充渐变色。
LinearGradientBrush类:使用线性渐变绘制区域。
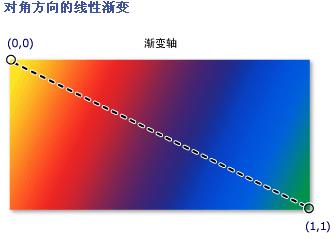
我们可以使用LinearGradientBrush类来绘制一个颜色渐变的区域,它有一个StartPoint属性表示线性渐变的二维起始坐标,而EndPoint指渐变的终止坐标。默认的线性渐变是沿对角方向进行的。
如图所示,它描绘了以对角线方向描绘渐变线
渐变值的取值范围是0-1,它用小数来表示从起点到终点的比率
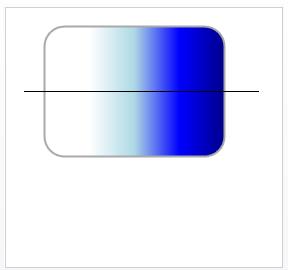
比如说,我们想要以水平中轴来做渐变线(如下图)
我们可以将调整StartPoint和EndPoint
<LinearGradientBrush StartPoint="0,0.5" EndPoint="1,0.5">
我们可以使用GradientStop来描述渐变的颜色和位置。
GradientStop类:描述渐变中过渡点的位置和颜色。
GradientStop的Color属性表示渐变的颜色,Offset表示渐变从上一个位置开始,到Offset位置结束的渐变
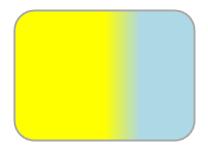
例如下面的代码
<LinearGradientBrush StartPoint="0,0.5" EndPoint="1,0.5">
<GradientStop Color="Yellow" Offset="0.5"></GradientStop>
<GradientStop Color="LightBlue" Offset="0.7"></GradientStop>
</LinearGradientBrush>
<GradientStop Color="Yellow" Offset="0.5"></GradientStop>
<GradientStop Color="LightBlue" Offset="0.7"></GradientStop>
</LinearGradientBrush>
它表示从0-0.5这个段区域的颜色是Yellow
0.5-0.7这段区域表示从Yellow到LightBlue的渐变
0.7-1这段区域的颜色是LightBlue


