首先提供两个XML文件
XML代码如下:
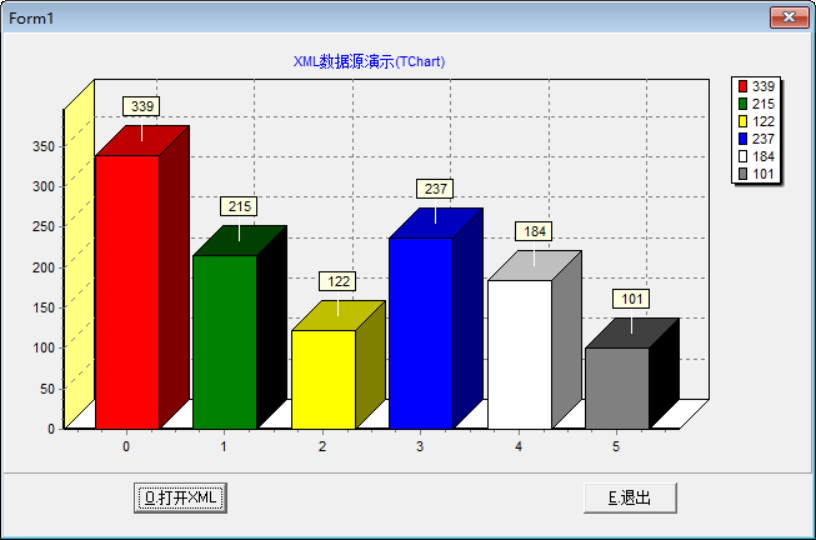
1、Example.xml


<?xml version="1.0" encoding="ISO-8859-1"?>
<chart>
<series title="Series1" type="Point" color="#FF0000">
<points count="6">
<point index="0" Y="339"/>
<point index="1" Y="215"/>
<point index="2" Y="122"/>
<point index="3" Y="237"/>
<point index="4" Y="184"/>
<point index="5" Y="101"/>
</points>
</series>

<series title="Series2" type="Point" color="#008000">
<points count="6">
<point index="0" Y="356"/>
<point index="1" Y="340"/>
<point index="2" Y="341"/>
<point index="3" Y="352"/>
<point index="4" Y="352"/>
<point index="5" Y="377"/>
</points>
</series>

<series title="Series3" type="Point" color="#FFFF00">
<points count="6">
<point index="0" Y="347"/>
<point index="1" Y="345"/>
<point index="2" Y="312"/>
<point index="3" Y="293"/>
<point index="4" Y="283"/>
<point index="5" Y="251"/>
</points>
</series>

<series title="Series4" type="Point" color="#0000FF">
<points count="6">
<point index="0" Y="180"/>
<point index="1" Y="191"/>
<point index="2" Y="200"/>
<point index="3" Y="194"/>
<point index="4" Y="164"/>
<point index="5" Y="131"/>
</points>
</series>

</chart>
2、Example1.xml
<?xml version="1.0" encoding="ISO-8859-1"?>
<chart>
<series title="Series1" type="Point" color="#FF0000">
<points count="6">
<point index="0" Y="100"/>
<point index="1" Y="215"/>
<point index="2" Y="122"/>
<point index="3" Y="237"/>
<point index="4" Y="184"/>
<point index="5" Y="101"/>
</points>
</series>

<series title="Series2" type="Point" color="#008000">
<points count="6">
<point index="6" Y="356"/>
<point index="7" Y="340"/>
<point index="8" Y="341"/>
<point index="9" Y="200"/>
<point index="10" Y="352"/>
<point index="11" Y="377"/>
</points>
</series>

<series title="Series3" type="Point" color="#FFFF00">
<points count="6">
<point index="0" Y="347"/>
<point index="1" Y="345"/>
<point index="2" Y="312"/>
<point index="3" Y="293"/>
<point index="4" Y="283"/>
<point index="5" Y="251"/>
</points>
</series>

<series title="Series4" type="Point" color="#0000FF">
<points count="6">
<point index="0" Y="180"/>
<point index="1" Y="191"/>
<point index="2" Y="200"/>
<point index="3" Y="194"/>
<point index="4" Y="164"/>
<point index="5" Y="131"/>
</points>
</series>

</chart>
界面代码:
object Form1: TForm1
  Left = 524
  Top = 351
  Width = 653
  Height = 432
  Caption = 'Form1'
  Color = clBtnFace
  Font.Charset = DEFAULT_CHARSET
  Font.Color = clWindowText
  Font.Height = -11
  Font.Name = 'MS Sans Serif'
  Font.Style = []
  OldCreateOrder = False
  OnCreate = FormCreate
  PixelsPerInch = 96
  TextHeight = 13
  object Chart1: TChart
    Left = 0
    Top = 0
    Width = 645
    Height = 353
    Title.Text.Strings = (
      'XML数据源演示(TChart)')
    Chart3DPercent = 45
    Align = alTop
    TabOrder = 0
    PrintMargins = (
      15
      22
      15
      22)
    object Series1: TBarSeries
      ColorEachPoint = True
      Marks.Callout.Brush.Color = clBlack
      Marks.Visible = True
      Gradient.Direction = gdTopBottom
      XValues.Name = 'X'
      XValues.Order = loAscending
      YValues.Name = 'Bar'
      YValues.Order = loNone
    end
    object Series2: TBarSeries
      Active = False
      ColorEachPoint = True
      Marks.Callout.Brush.Color = clBlack
      Marks.Visible = True
      DataSource = TeeXMLSource3
      BarStyle = bsRectGradient
      Gradient.Direction = gdTopBottom
      XValues.Name = 'X'
      XValues.Order = loAscending
      YValues.Name = 'Bar'
      YValues.Order = loNone
    end
  end
  object Button1: TButton
    Left = 104
    Top = 360
    Width = 75
    Height = 25
    Caption = '&O.打开XML'
    TabOrder = 1
    OnClick = Button1Click
  end
  object Button2: TButton
    Left = 464
    Top = 360
    Width = 75
    Height = 25
    Caption = '&E.退出'
    TabOrder = 2
    OnClick = Button2Click
  end
  object TeeXMLSource1: TTeeXMLSource
    Active = True
    Chart = Chart1
    FileName =
      'C:\Users\Lenovo\Desktop\TestD7\ChartDemo\第二章\7、数据源组件TeeXMLSource' +
      '\Example.xml'
    Series = Series1
    SeriesNode = 'Series1'
    ValueSource = 'Y'
  end
  object TeeXMLSource3: TTeeXMLSource
    Active = True
    FileName =
      'C:\Users\Lenovo\Desktop\TestD7\ChartDemo\第二章\7、数据源组件TeeXMLSource' +
      '\Example1.xml'
    Series = Series2
    SeriesNode = 'Series2'
    ValueSource = 'Y'
  end
end
功能代码:
unit Unit1;

interface

uses
  Windows, Messages, SysUtils, Variants, Classes, Graphics, Controls, Forms,
  Dialogs, TeEngine, TeeURL, TeeXML, StdCtrls, Series, ExtCtrls, TeeProcs,
  Chart, TeeSeriesTextEd;

type
  TForm1 = class(TForm)
    Chart1: TChart;
    Series1: TBarSeries;
    Series2: TBarSeries;
    Button1: TButton;
    Button2: TButton;
    TeeXMLSource1: TTeeXMLSource;
    TeeXMLSource3: TTeeXMLSource;
    procedure FormCreate(Sender: TObject);
    procedure Button2Click(Sender: TObject);
    procedure Button1Click(Sender: TObject);
  private
    { Private declarations }
  public
    { Public declarations }
  end;

var
  Form1: TForm1;

implementation

{$R *.dfm}

procedure TForm1.FormCreate(Sender: TObject);
begin
  Position := poScreenCenter;
  BorderStyle := bsDialog;
end;

procedure TForm1.Button2Click(Sender: TObject);
begin
  Close;
end;

procedure TForm1.Button1Click(Sender: TObject);
begin
  TeeXMLSource1.Chart := Chart1;
  TeeXMLSource1.Series := Series1;
  TeeXMLSource1.ValueSource := 'Y';
  //这里LoadFromFile好像没什么用。
//  TeeXMLSource1.LoadFromFile('Example1.xml');
  TeeXMLSource1.FileName := 'Example1.xml';
  TeeXMLSource1.Active := True;
end;

end.

 浙公网安备 33010602011771号