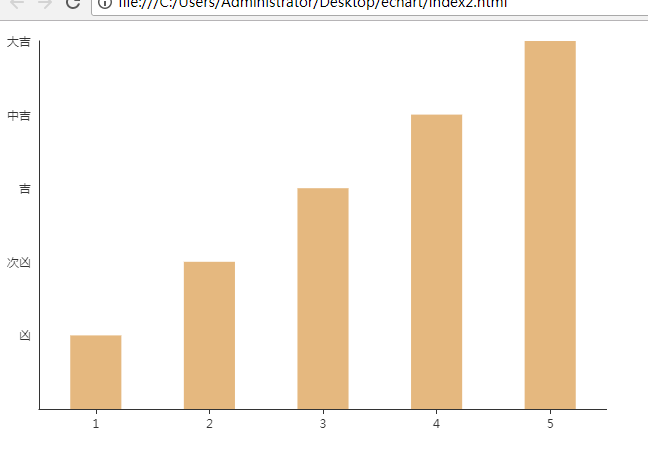
Echart自定义y轴刻度信息2
<!DOCTYPE html>
<html>
<head>
    <meta charset="utf-8">
    <title>ECharts</title>
    <!-- 引入 echarts.js -->
    <script src="echarts.common.min.js"></script>
</head>
<body>
    <div id="container" style="width: 600px;height:400px;"></div>
    <script type="text/javascript">
        var dom = document.getElementById("container");
        var myChart = echarts.init(dom);
        var app = {};
        option = null;
        app.title = '坐标轴刻度与标签对齐';

        option = {
            color: ['#e5b87f'],
            tooltip : {
                trigger: 'axis',
                axisPointer : {            // 坐标轴指示器,坐标轴触发有效
                    type : 'line'        // 默认为直线,可选为:'line' | 'shadow'
                }
            },
            grid: {
                top: '3%',
                left: '0',
                right: '0',
                bottom: '0',
                containLabel: true
            },
            xAxis : [
                {
                    type : 'category',
                    data : [1,2,3,4,5],  //数据值
                    axisTick: {
                        alignWithLabel: true
                    }
                }
            ],
            // yAxis:{},//默认
            yAxis: {
            axisTick : {show: false},//去掉刻度
            splitLine:{      //去掉背景水平网格线
                show:false
            },
            min:0,
            max:5,
            axisLabel:{
               // 自定义y轴刻度信息
                    formatter: function (value) {
                        var texts = [];
                        if(value==0){}
                        else if(value==1){
                            texts.push('凶');
                        }
                        else if (value ==2) {
                            texts.push('次凶');
                        }
                        else if (value == 3) {
                            texts.push('吉');
                        }
                        else if(value == 4){
                            texts.push('中吉');
                        }
                        else{
                            texts.push('大吉');
                        }
                        return texts;
                    }
                }
            },
            series : [
                {
                    name:'直接访问',
                    type:'bar',
                    barWidth: '45%',
                    data:[1,2,3,4,5,6,7,8,9,10,11,12] //x轴1到12月份
                }
            ]
        };
        ;
        if (option && typeof option === "object") {
            myChart.setOption(option, true);
        }
    </script>
</body>
</html>
效果图:


 浙公网安备 33010602011771号