
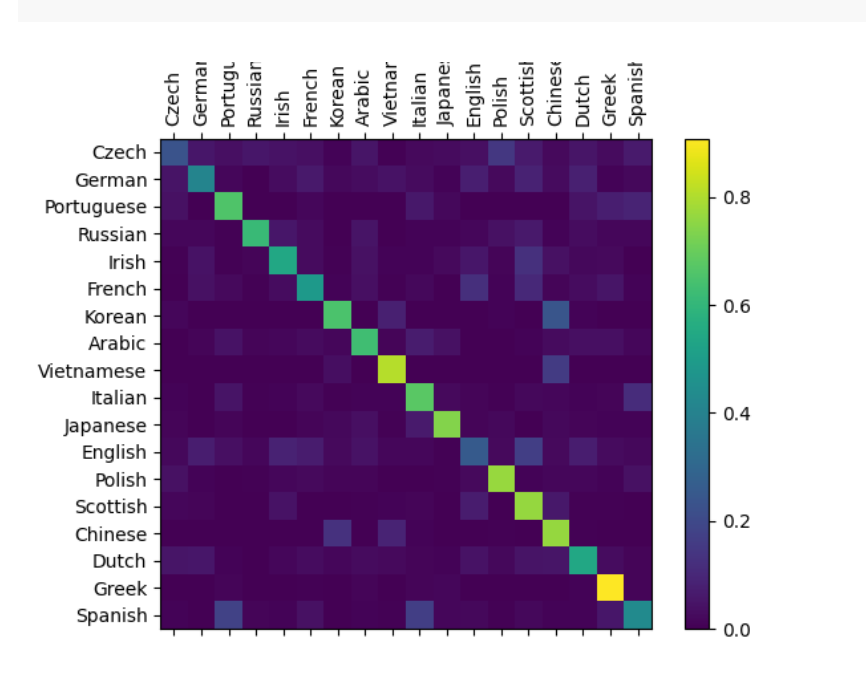
Plot Matplotlib
# Set up plot
fig = plt.figure()
ax = fig.add_subplot(111)
cax = ax.matshow(confusion.numpy())
fig.colorbar(cax)

# Set up axes
ax.set_xticklabels([''] + all_categories, rotation=90)
ax.set_yticklabels([''] + all_categories)

# Force label at every tick
ax.xaxis.set_major_locator(ticker.MultipleLocator(1))
ax.yaxis.set_major_locator(ticker.MultipleLocator(1))

# sphinx_gallery_thumbnail_number = 2
plt.show()
https://pytorch.org/tutorials/intermediate/char_rnn_classification_tutorial.html

 浙公网安备 33010602011771号