Rust GUI库egui/eframe初探入门(五):使用egui_plot进行绘图
在上一篇中,我们使用了plotters这个绘图库配合egui_plotters库来为egui/eframe创造的界面中绘制图线:
Rust GUI库egui/eframe初探入门(四):使用egui_plotters进行绘图
但是,由于egui_plotters这个库是第三方库,缺乏更新,目前暂时只能配合较老版本的egui/eframe库使用,为我们带来了不便。
Rust中的plotters库是一个强大的绘图库,能够绘制等高线图、热力图以及三维图线等。但若我们不需要高阶的绘图功能,其实不必使用它来为egui/eframe绘制图线。
我们可以使用egui_plot这个库为我们的egui/eframe界面绘制图线。该库为egui官方绘图库,保持和egui同步更新,所以不会再遇到最新版本适配上的问题。
现在我们来使用egui_plot库来实现上一篇中的同样功能。
导入egui_plot库
首先,我们为cargo.toml添加依赖。目前我们没有特定版本需求的问题,都可以使用最新的库版本,所以可以直接使用命令行添加依赖:
cargo add eframe egui_plot image
根据当前的最新版本,添加依赖后的cargo.toml文件中的依赖部分为:
[dependencies]
eframe = "0.26.2"
egui_plot = "0.26.2"
image = "0.24.8"
增加绘图代码
代码在上上篇的基础上修改:
Rust GUI库egui/eframe初探入门(三):实现动态读取图片并显示
先看完整程序代码:
use eframe::egui::{self,IconData};
use std::sync::Arc;
use egui_plot::{Line, Plot, PlotPoints};
use image;

fn load_fonts(ctx: &egui::Context) {
    let mut fonts = egui::FontDefinitions::default();
    fonts.font_data.insert("my_font".to_owned(),
    egui::FontData::from_static(include_bytes!("ChillRoundGothic_Bold.ttf")));
    fonts.families.get_mut(&egui::FontFamily::Proportional).unwrap()
        .insert(0, "my_font".to_owned());
    fonts.families.get_mut(&egui::FontFamily::Monospace).unwrap()
        .push("my_font".to_owned());
    ctx.set_fonts(fonts);
}
fn main() {
    let mut native_options = eframe::NativeOptions::default();
    let icon_data = include_bytes!("icon.png");
    let img = image::load_from_memory_with_format(icon_data, image::ImageFormat::Png).unwrap();
    let rgba_data = img.into_rgba8();
    let (w,h)=(rgba_data.width(),rgba_data.height());
    let raw_data: Vec<u8> = rgba_data.into_raw();
    native_options.viewport.icon=Some(Arc::<IconData>::new(IconData { rgba:  raw_data, width: w, height: h }));
    eframe::run_native("外特性计算", native_options, Box::new(|cc| Box::new(MyEguiApp::new(cc))));
}
struct MyEguiApp {
    P:f64,
    T:f64,
    n:f64,
    image_show:bool
}
impl MyEguiApp {
    fn new(cc: &eframe::CreationContext<'_>) -> Self {
        load_fonts(&cc.egui_ctx);
        Self {P:80.0,T:200.0,n:12000.0,image_show:false}
    }
}
impl eframe::App for MyEguiApp {
   fn update(&mut self, ctx: &egui::Context, frame: &mut eframe::Frame) {
        egui::SidePanel::left("LeftBar").show(ctx,|ui|{
            ui.add(egui::DragValue::new(&mut self.P).prefix("最大功率:").suffix("kW").clamp_range(0.1..=1500.0));
            ui.add(egui::DragValue::new(&mut self.T).prefix("最大扭矩:").suffix("Nm").clamp_range(0.1..=3000.0));
            ui.add(egui::DragValue::new(&mut self.n).prefix("最高转速:").suffix("rpm").clamp_range(0.1..=25000.0).speed(200));
            if ui.button("显示曲线").clicked(){
                self.image_show=true;
            }
            if ui.button("隐藏曲线").clicked(){
                self.image_show=false;
            }
        });
        egui::CentralPanel::default().show(ctx, |ui| {
            if self.image_show==true{
                let rated_speed=self.P*9550.0/self.T;
                let external_characteristic:PlotPoints=(0..self.n.ceil() as usize).map(|i| {
                        let x = i as f64;
                        [x, if x<rated_speed{self.T}else{self.P*9550.0/i as f64}]
                    }).collect();
                let line = Line::new(external_characteristic).name("external_characteristic");
                let plot=Plot::new("my_plot");
                plot.include_y(0.0)
                .set_margin_fraction(egui::vec2(0., 0.1))
                .x_axis_label("转速(rpm)")
                .y_axis_label("扭矩(N)")
                .label_formatter(|name, value| {
                    if !name.is_empty(){
                        format!("转速:{:.*}\n扭矩:{:.*}",1,value.x,1,value.y)
                    }else{
                        "".to_owned()
                    }
                })
                .show(ui, |plot_ui| plot_ui.line(line));
            }
        });
   }
}
现在重点看程序的最后一部分update函数中使用egui_plot绘图的部分。
egui_plot中的PlotPoints类型是Vector,其元素为两个f64构成的数组,它是一系列散点的集合,每个数组元素中的两个f64值分别代表散点的x值和y值。我们使用map闭包构建这样一个散点的集合。
egui_plot中的Line类型则是我们将要绘制的线条,用先前绘制的散点来构造它。同时我们用.name方法给Line起个名字。后面会用得到。
最后我们开始画图,使用Plot结构体的new方法,创造一个Plot。调用Plot的show方法,并在闭包中使用line方法来画出线条,传递给line方法的变量正是我们前面创建的Line类型的变量。
在调用show方法之前,我们还用过plot.include_y(0.0)设置了绘制曲线的y值坐标需要从0开始;使用set_margin_fraction()方法设置图像的y向高度有10%的富余量以便获得更佳的视觉效果;使用 .x_axis_label()、y_axis_label()设置x、y轴的标签名称;使用label_formatter()方法设置鼠标悬停在图像上时的文字显示。鼠标悬停在图像上时,如果离绘制的曲线较近,会自动捕捉到附近的曲线上的点。当捕捉到了曲线,label_formatter()方法能够得到该曲线的name,就是我们前面给曲线起的名字。如果有多个曲线,我们就能轻易区分。如果没能够捕捉到附近的曲线,name将为空。所以我们能够使用if语句对name是否为空进行判断,以便确定是否要显示当前的x、y值坐标。我们也可以尝试删除label_formatter()方法,采用默认的设置,那样的话,鼠标悬停在图像中任何地方都能够显示此处的x、y值。
现在我们编译运行,就能够得到如下界面了:
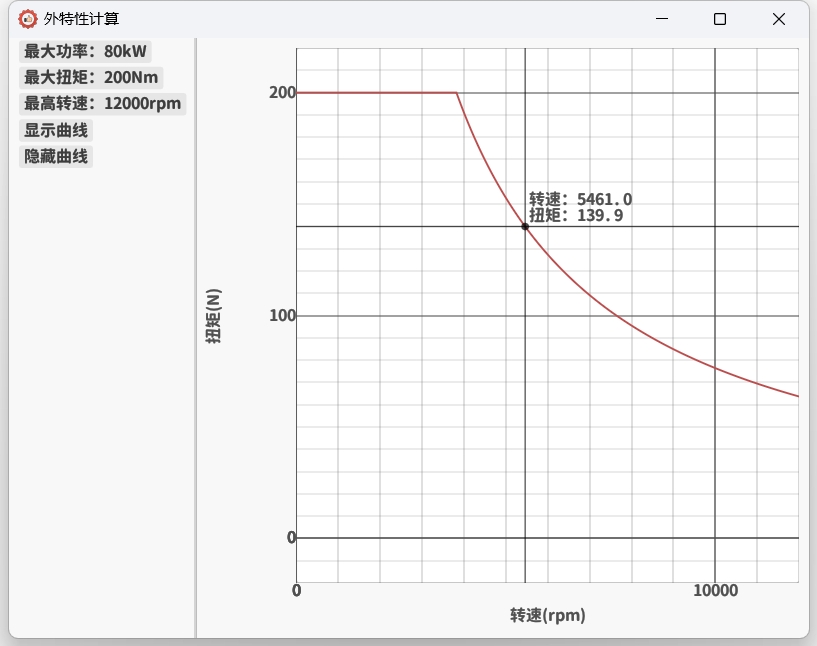
现在我们实现了使用egui_plot库来为egui/eframe程序绘制图线了。
我们可以发现egui_plot配合eframe使用相当快捷易用。唯一的问题只是egui_plot缺乏一些高级的绘图功能,只能做一些相对基础的图线绘制。所以我们可以根据具体的需求来决定使用egui_plot还是plotters库来为我们的应用绘制图形。

 浙公网安备 33010602011771号