Rust GUI库egui/eframe初探入门(三):实现动态读取图片并显示
上一篇我们已经能在编译期读入图片并在运行时显示了:
Rust GUI库egui/eframe初探入门(二):更换图标和字体,实现中文界面
这一次我们来实现一下程序运行时动态读取图片并显示。本次我们制作一个简单的绘制电机外特性曲线的程序。我们打算为程序分区,左边区域用来放置参数输入和按钮控件,右边区域用来显示图像。为了实现这个功能,我们首先认识一下Panel。
使用SidePanel
此前我们一直将所有控件都放在了一个CentralPanel中。一个Panel可以理解为一块放置控件的平面区域。CentralPanel表示居中的区域。除此之外还可以通过TopBottomPanel::top()、TopBottomPanel::Bottom()、SidePanel::left()、SidePanel::right()实现上、下、左、右的平面区域。
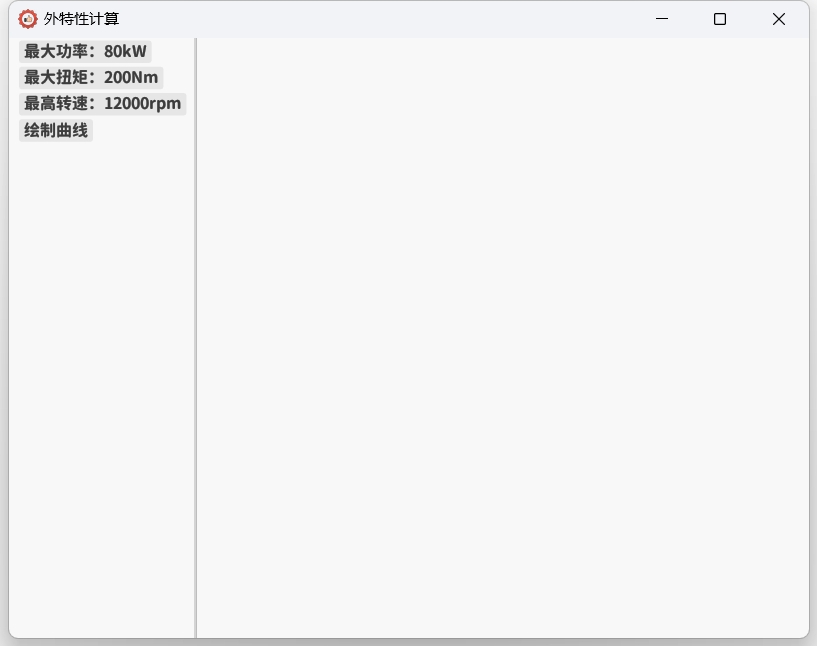
此次我们将CentralPanel作为绘图区,然后以左侧的SidePanel作为其它控件区。
impl eframe::App for MyEguiApp {
   fn update(&mut self, ctx: &egui::Context, frame: &mut eframe::Frame) {
        egui::SidePanel::left("LeftBar").show(ctx,|ui|{
            ui.add(egui::DragValue::new(&mut self.P).prefix("最大功率:").suffix("kW").clamp_range(0.1..=1500.0));
            ui.add(egui::DragValue::new(&mut self.T).prefix("最大扭矩:").suffix("Nm").clamp_range(0.1..=3000.0));
            ui.add(egui::DragValue::new(&mut self.n).prefix("最高转速:").suffix("rpm").clamp_range(0.1..=25000.0));
            if ui.button("绘制曲线").clicked(){
                //待填入
            }
        });
        egui::CentralPanel::default().show(ctx, |ui| {
		//待填入
        });
   }
}
同时我们在结构体中也输入相应的变量声明和初始化代码:
struct MyEguiApp {
    P:f64,
    T:f64,
    n:f64,
    image_show:bool
}

impl MyEguiApp {
    fn new(cc: &eframe::CreationContext<'_>) -> Self {
        load_fonts(&cc.egui_ctx);
        egui_extras::install_image_loaders(&cc.egui_ctx);
        Self {P:80.0,T:200.0,n:12000.0,image_show:false}
    }
}
此时我们就能编译运行程序,看到被左右分区的窗口了。
这里我们加入了DragValue控件,该控件既可以手动输入数字,也可以使用拖动的方法调整数字的大小,并且如果输入的不是合法数字,在退出该控件激活时,文本能够自动恢复成最后一次合法的数字文本。同时我们使用了DragValue的prefix()和suffix()方法来增加前缀与后缀显示,并以clamp_range()方法来限值输入的数字大小范围。
添加与使用plotters库
在cargo.toml中添加plotters库,并且在程序中导入该库use plotters::prelude::*;。
接下来我们在程序中写入一个使用该库绘图的函数,该函数接收一个MyEguiApp结构体的引用,以取出我们输入的数据。然后再使用plotters库绘制出电机外特性图形并存储到当前目录下。代码如下:
fn plot_characteristic(data:&MyEguiApp)-> Result<(), Box<dyn std::error::Error>> {
    let max_speed=data.n as f32;
    let max_torque=data.T as f32;
    let max_power=data.P as f32;
    let rated_speed=max_power*9550.0/max_torque;
    let root = BitMapBackend::new("external_characteristic.png", (800, 600)).into_drawing_area();
    root.fill(&WHITE)?;
    let mut chart = ChartBuilder::on(&root)
        .caption("external characteristic", ("sans-serif", 50).into_font())
        .margin(5)
        .x_label_area_size(30)
        .y_label_area_size(30)
        .build_cartesian_2d(0f32..max_speed*1.05, 0f32..max_torque*1.05)?;

    chart.configure_mesh().draw()?;

    chart
        .draw_series(LineSeries::new(
            (0..=max_speed as i32).map(|x| x as f32).map(|x| {if x<=rated_speed{(x,max_torque)}else{(x,max_power*9550.0/x)}}),
            &RED,
        ))?
        .label("Torque")
        .legend(|(x, y)| PathElement::new(vec![(x, y), (x + 20, y)], &RED));

    chart
        .configure_series_labels()
        .background_style(&WHITE.mix(0.8))
        .border_style(&BLACK)
        .draw()?;
    root.present()?;
    Ok(())
}
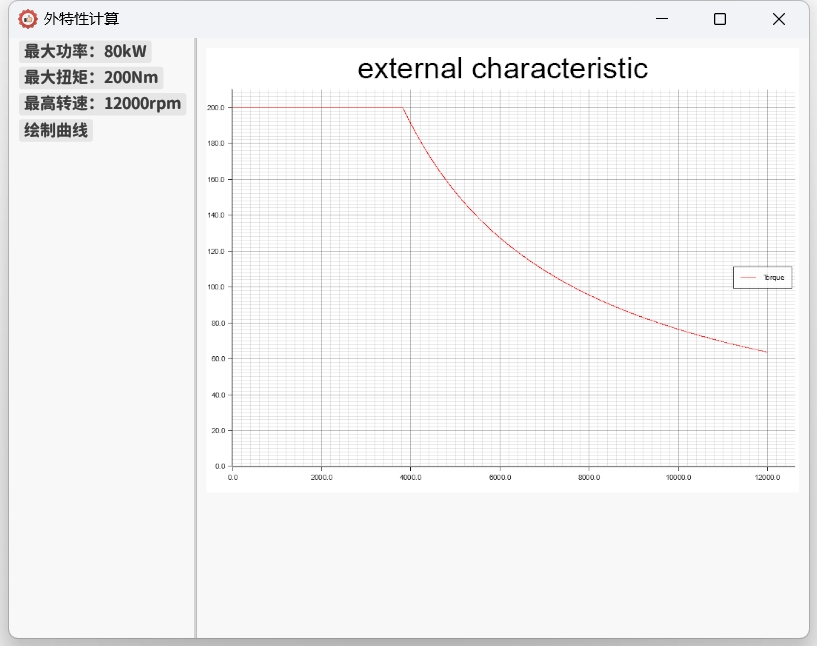
该函数绘制一张800×600的图像,以"external_characteristic.png"的名字进行文件存储。图线为电机的扭矩外特性:在临界转速以前,按最大扭矩进行输出;在临界转速以后,按最大功率进行输出;临界转速为既是最大功率、也是最大扭矩输出的那个转速点。
接着我们在前述的UI代码区,补全代码逻辑:在按钮按下绘图后,执行一次绘图函数,并令self.image_show的值为true;在CentralPanel判断self.image_show的值为true时,则从当前目录读取图片并显示出来。该段代码如下:
impl eframe::App for MyEguiApp {
   fn update(&mut self, ctx: &egui::Context, frame: &mut eframe::Frame) {
        egui::SidePanel::left("LeftBar").show(ctx,|ui|{
            ui.add(egui::DragValue::new(&mut self.P).prefix("最大功率:").suffix("kW").clamp_range(0.1..=1500.0));
            ui.add(egui::DragValue::new(&mut self.T).prefix("最大扭矩:").suffix("Nm").clamp_range(0.1..=3000.0));
            ui.add(egui::DragValue::new(&mut self.n).prefix("最高转速:").suffix("rpm").clamp_range(0.1..=25000.0));
            if ui.button("绘制曲线").clicked(){
                plot_characteristic(&self);
                self.image_show=true;
            }
        });
        egui::CentralPanel::default().show(ctx, |ui| {
            if self.image_show==true{
                ui.image("file://external_characteristic.png");
            }
        });
   }
}
现在可以编译运行进行画图了:
完整代码如下:
use eframe::egui::{self,IconData};
use std::sync::Arc;
use image;
use plotters::prelude::*;
use egui_extras;

fn load_fonts(ctx: &egui::Context) {
    let mut fonts = egui::FontDefinitions::default();
    fonts.font_data.insert("my_font".to_owned(),
    egui::FontData::from_static(include_bytes!("ChillRoundGothic_Bold.ttf")));
    fonts.families.get_mut(&egui::FontFamily::Proportional).unwrap()
        .insert(0, "my_font".to_owned());
    fonts.families.get_mut(&egui::FontFamily::Monospace).unwrap()
        .push("my_font".to_owned());
    ctx.set_fonts(fonts);
}

fn plot_characteristic(data:&MyEguiApp)-> Result<(), Box<dyn std::error::Error>> {
    let max_speed=data.n as f32;
    let max_torque=data.T as f32;
    let max_power=data.P as f32;
    let rated_speed=max_power*9550.0/max_torque;

    let root = BitMapBackend::new("external_characteristic.png", (800, 600)).into_drawing_area();
    root.fill(&WHITE)?;
    let mut chart = ChartBuilder::on(&root)
        .caption("external characteristic", ("sans-serif", 50).into_font())
        .margin(5)
        .x_label_area_size(30)
        .y_label_area_size(30)
        .build_cartesian_2d(0f32..max_speed*1.05, 0f32..max_torque*1.05)?;

    chart.configure_mesh().draw()?;

    chart
        .draw_series(LineSeries::new(
            (0..=max_speed as i32).map(|x| x as f32).map(|x| {if x<=rated_speed{(x,max_torque)}else{(x,max_power*9550.0/x)}}),
            &RED,
        ))?
        .label("Torque")
        .legend(|(x, y)| PathElement::new(vec![(x, y), (x + 20, y)], &RED));

    chart
        .configure_series_labels()
        .background_style(&WHITE.mix(0.8))
        .border_style(&BLACK)
        .draw()?;
    root.present()?;
    Ok(())
}

fn main() {
    let mut native_options = eframe::NativeOptions::default();
    let icon_data = include_bytes!("icon.png");
    let img = image::load_from_memory_with_format(icon_data, image::ImageFormat::Png).unwrap();
    let rgba_data = img.into_rgba8();
    let (w,h)=(rgba_data.width(),rgba_data.height());
    let raw_data: Vec<u8> = rgba_data.into_raw();
    native_options.viewport.icon=Some(Arc::<IconData>::new(IconData { rgba:  raw_data, width: w, height: h }));
    eframe::run_native("外特性计算", native_options, Box::new(|cc| Box::new(MyEguiApp::new(cc))));
}

struct MyEguiApp {
    P:f64,
    T:f64,
    n:f64,
    image_show:bool
}

impl MyEguiApp {
    fn new(cc: &eframe::CreationContext<'_>) -> Self {
        load_fonts(&cc.egui_ctx);
        egui_extras::install_image_loaders(&cc.egui_ctx);
        Self {P:80.0,T:200.0,n:12000.0,image_show:false}
    }
}

impl eframe::App for MyEguiApp {
   fn update(&mut self, ctx: &egui::Context, frame: &mut eframe::Frame) {
        egui::SidePanel::left("LeftBar").show(ctx,|ui|{
            ui.add(egui::DragValue::new(&mut self.P).prefix("最大功率:").suffix("kW").clamp_range(0.1..=1500.0));
            ui.add(egui::DragValue::new(&mut self.T).prefix("最大扭矩:").suffix("Nm").clamp_range(0.1..=3000.0));
            ui.add(egui::DragValue::new(&mut self.n).prefix("最高转速:").suffix("rpm").clamp_range(0.1..=25000.0));
            if ui.button("绘制曲线").clicked(){
                plot_characteristic(&self);
                self.image_show=true;
            }
        });
        egui::CentralPanel::default().show(ctx, |ui| {
            if self.image_show==true{
                ui.image("file://external_characteristic.png");
            }
        });
   }
}

 浙公网安备 33010602011771号