SciTech-Mathmatics-Probability+Statistics:Quantifing Uncertainty_统计数据分析:朱怀球PKU-3-Sampling Theory 统计抽样理论基础
Statistics & Data Analysis
— Zhu Huaiqiu, Peking University
《统计与数据分析》, 朱怀球, 北京大学
7 Steps
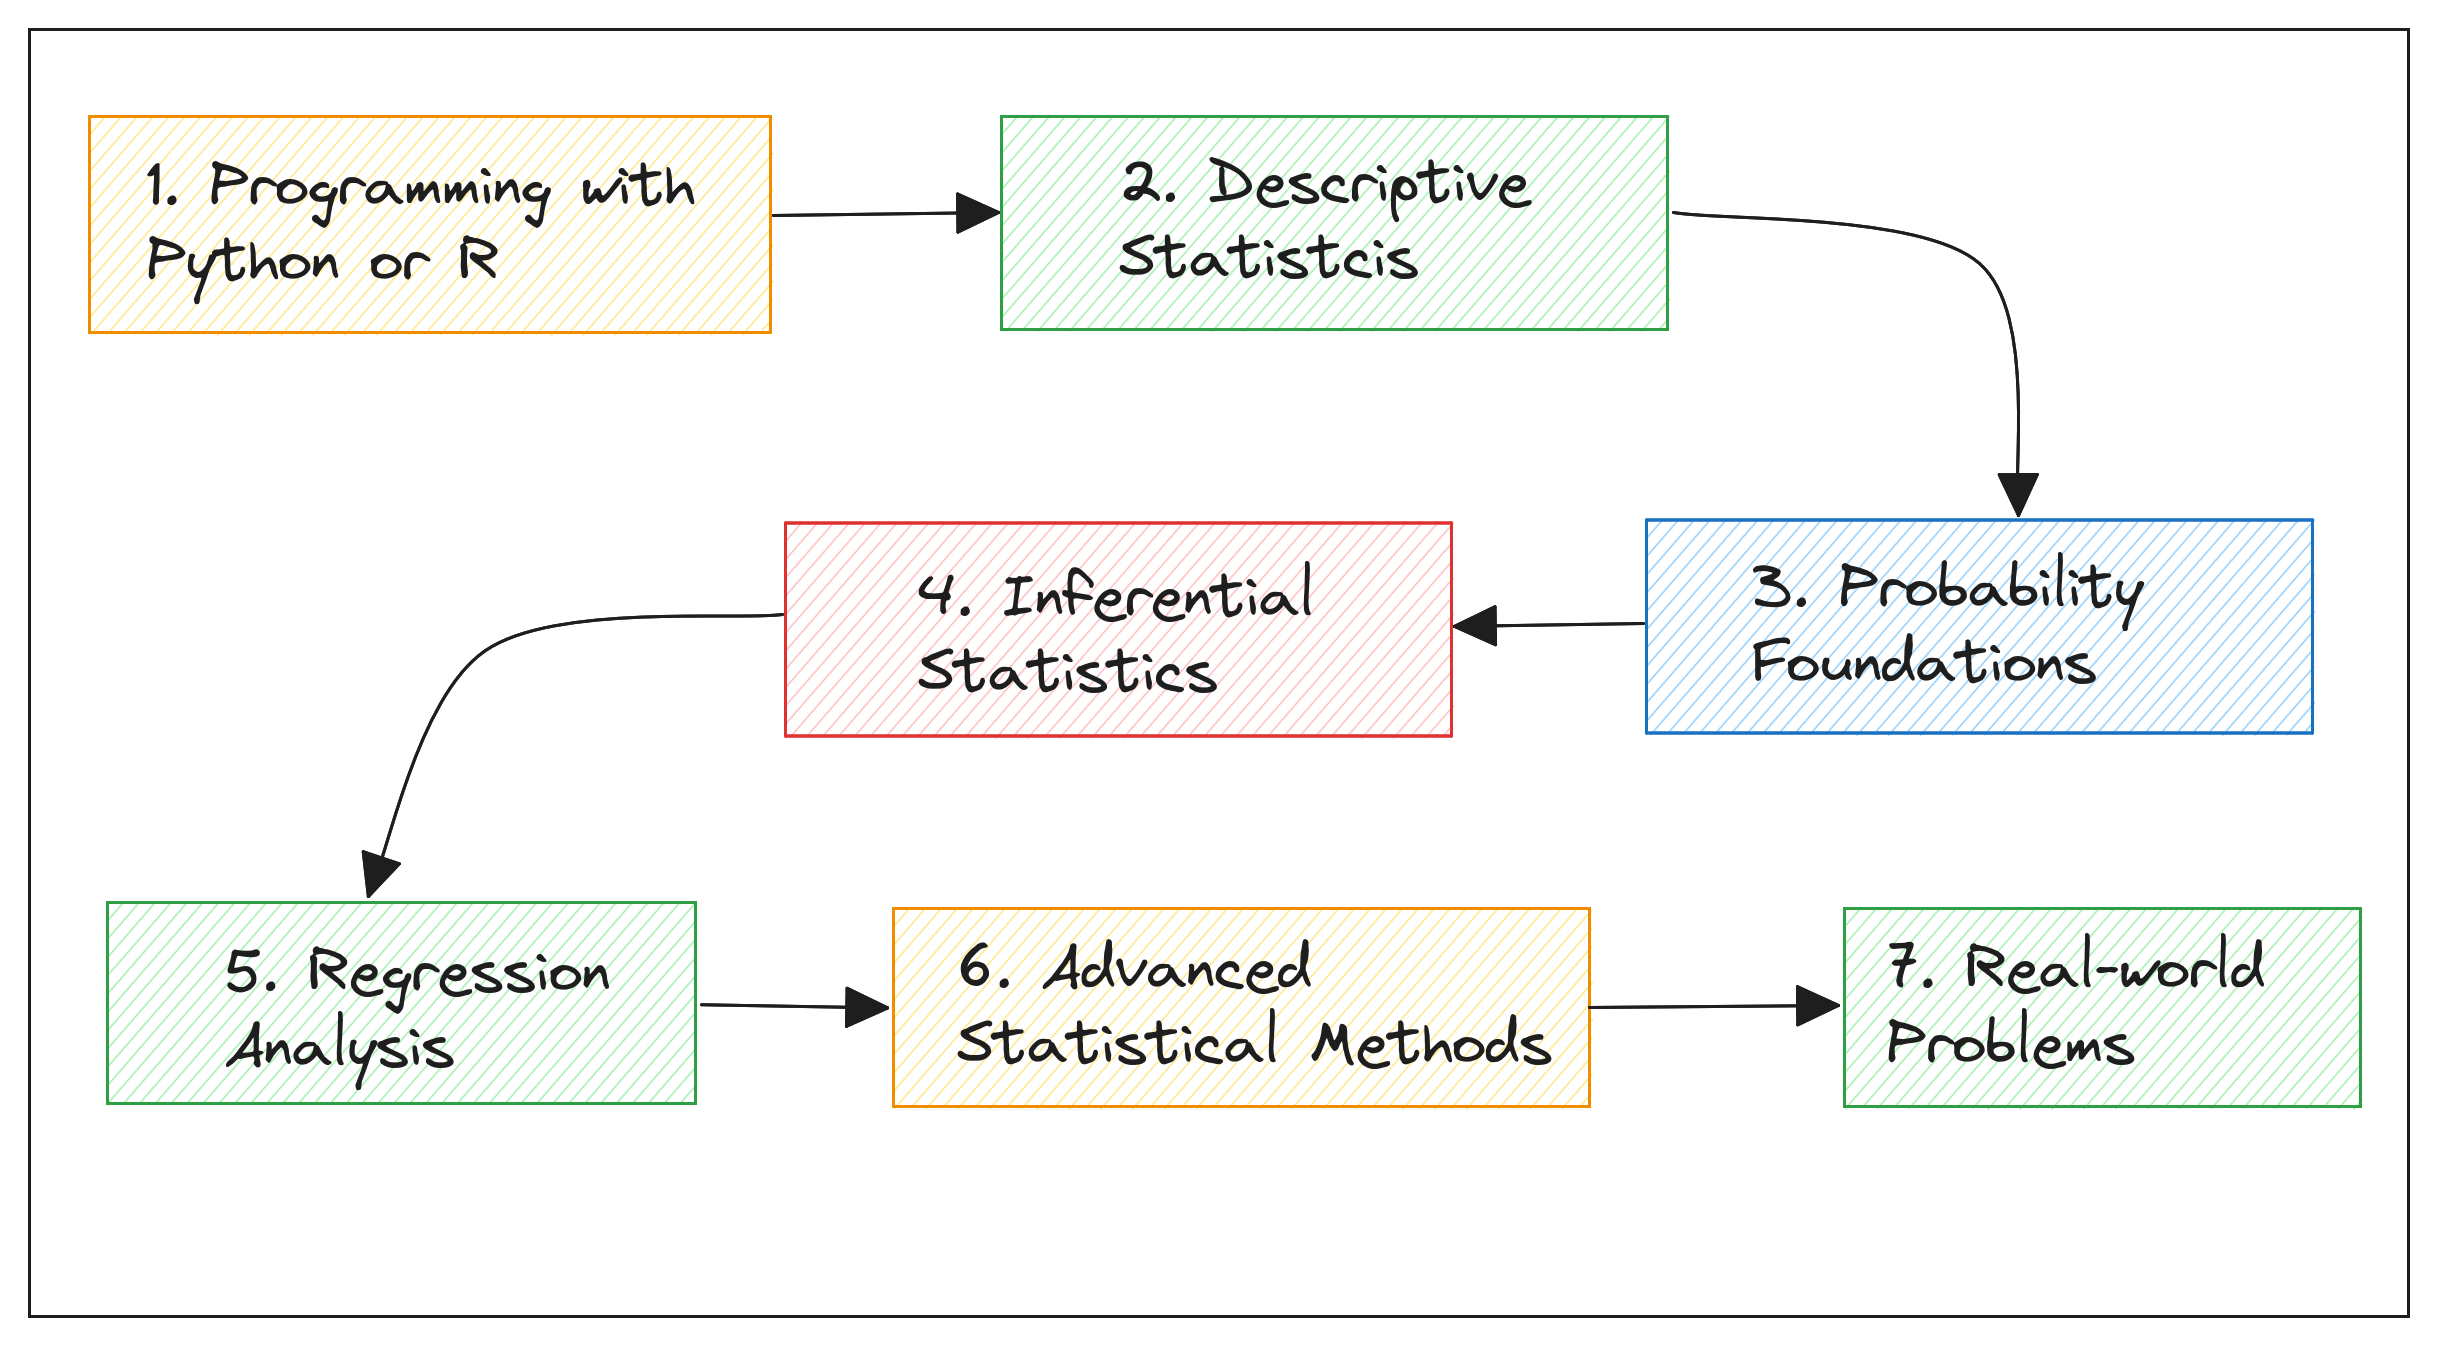
§3 统计抽样理论基础
"\(\large \text{ Get your facts first, then you can distort them as you please.}\)"
— \(\large Mark\ Twin\)
"\(\large \text{ Our behavior, attitudes, and sometimes actions are based on samples.}\)"
— \(\large Elements\ of\ Sampling\ Theory\ and\ Methods\)
3.1 统计抽样的基本概念
Comparing: Statistics 和 Probability
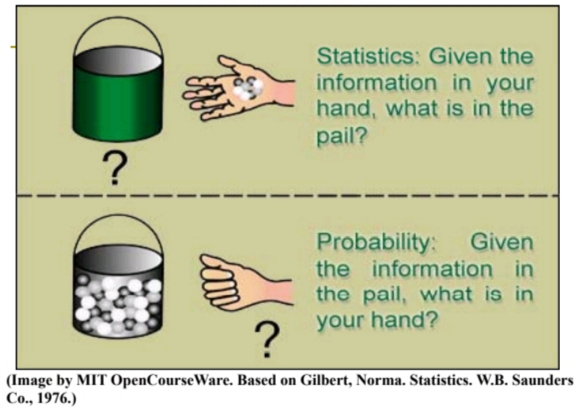
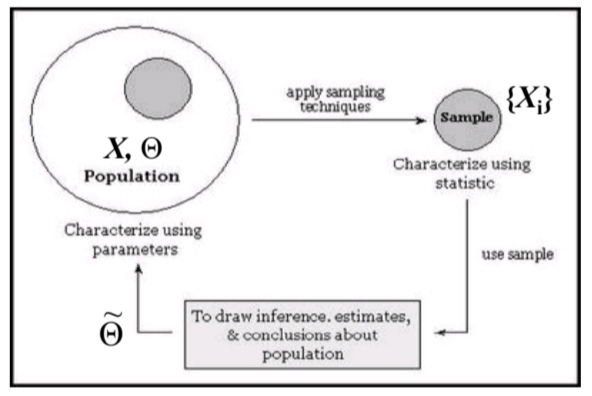
Statistics基本思想( 总体 — 样本 — 总体 )
\(\large \begin{array}{rl} \\
X :& \bm{ Population },\ Statistics: \mu,\ \tau, \sigma, \ \sigma^2 \\
\Theta :& \bm{ Parameter\ Space } \\
\theta :& \bm{ Parameter } \\
\{X_i\}:& \bm{Sample} ,\ Statistics: \overset{-}{x}, \ \\
\overset{\sim}{\Theta}:& \bm{ Parameter\ Estimation } \\
\end{array}\)
Sampling Concept(抽样 的 概念)
For \(\large \text{ one existing }\) \(\large \bm{Measuring\ Population }\) (named \(\large \bm{\text{Simple Population}}\)),
sample \(\large \bm{Measuring\ Sample}\) (named \(\large \bm{\text{Simple Sample}}\) ) from the \(\large \bm{\text{Simple Population}}\)), using specific sort of \(\large \bm{\text{Inference Method}}\).
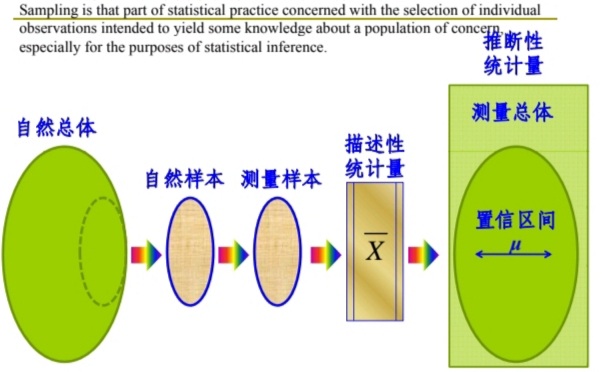
\(\large \begin{array} {lll} \\ \bm{ Population(Natural) } &\Rightarrow \bm{ Sample(Natural) } &\Rightarrow \bm{ Sample(Measuring) } \\ \bm{ Sample(Measuring) } &\Rightarrow \bm{ Descriptive\ Statistics } &\Rightarrow \bm{ Population(Measuring) } \end{array}\)
Sampling & Statistics
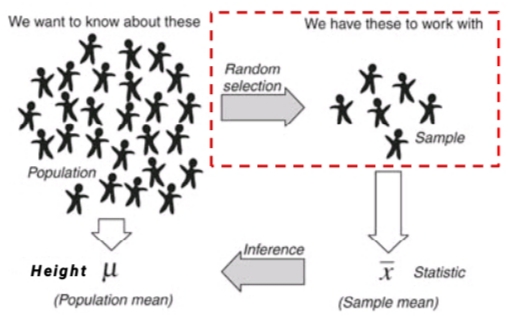
Parameters & Statistics
-
Parameters(of Population) and Statistics(of Sample)
-
1.4.1 Statistics(统计变量) 和 Observation(观测) of Statistical Resources(统计资料)
-
Statistics(统计变量):
研究对象的、可测量的特征
且对于一组对象中的不同对象可以取不同的值。 -
Observation Value(观测值): 变量的每一个测量值(x,x)
- Quanlitative Variable(定性变量): Non-Rankable观测值, 特征的 量值不能排序
- Quantitative Variable(定量变量): Rankable 观测值, 特征的 数量可以排序
- Discrete Variable
- Continuous Variable
-
Statistical Function:
- 函数关系,运用统计方法确定的,自变量和因变量之间的,
- 只需要定义域、值域和两个变量间的对应关系,
并不总是需要等式表达式
-
Statistical Resources(统计资料):
观测结果组成的集合- 定性统计资料、定量统计资料
- 连续统计资料、离散统计资料
- 有效数字: 在观测尺度(或科学计算)中实际能够得到的所有数字
常见问题:- \(\large 102个细胞\)
- \(\large 10,100个细菌(精确到100) \ \rightarrow\ 10,050 \text{ ~ } 10,150\)
- \(\large 23.4\%(23.437201\%?)\)
- \(\large 4.15 \text{ ~ } 4.25\ \times\ 10^{-3}\)
-
-
Observation of Statistics(统计变量的观测)
统计资料测量值, 受各种随机因秦的影响
-
System Error(系统误差)
System Error(系统误差)的大小,
- 稳定(观测过程不变),
- 可预测(用计算或实验方法可求得),
- 可补偿(可修正或调整使其减少).
-
Random Error(随机误差):
在相同条件下, 对同一Statistic的多次观测,
由于各种 Random Factors, 会出现测量值时而偏大、时而偏小的误差现象, 这种类型的误差叫Random Error。
在确定的测量条件, 对同一Statistic多次测量并用它的算术平均值, 作为它的测量结果, 能够比较好地减少Random Error。Statistical Rules of Random Error
-
- 绝对值相等的 正的与负的 误差 出现的机会相同
-
- Variance: 绝对值小的误差 比 绝对值大的误差 出现的机会多
-
- Range: 误差 不会超出 一定的范围。
-
-
-
Descriptive Statistics(of Samples)
Population Parameters
设总体 \(\large X\) 容量为 \(\large N\), 个体取值为\(\large \{x _i \},\ i \in [1, N]\), 定义:
\(\large \begin{array}{ll} \\
\text{ population }mean : & \mu = \dfrac{1}{N} \overset{N}{\underset{i =1}{\sum}}{ x_i } \\
\text{ population }total : & \tau = \dfrac{1}{N} \overset{N}{\underset{i =1}{\sum}}{ x_i } = N \cdot \mu \\
\text{ population }variance : & \sigma^2 = \dfrac{1}{N} \overset{N}{\underset{i =1}{\sum}}{ (x_i - \mu)^2 } \\
\text{ population }standard\ deviation : & s = \sqrt{ \sigma^2 } \\
\end{array}\)
3.1.1 Statistical Model and Statistical Sampling Model
- Statistical Model:
- 设 \(\large \{\Omega, F_{\Omega}\} \ 为可定义\ p.\ f.\ 的\ Measurable\ Space\),
- \(\large \Omega\ is \text{ Sample Space }\)
- \(\large F_{\Omega}\ is \text{ p. f.(Probability Function) }\)
$\large \text{ for measuring the } \bm{Likelyhood} \text{ of the each } \bm{Outcome} $
- \(\large \Phi \text{ 为其上的一个} \bm{ Distribution\ Cluster(概率分布族) }\),
- 设 \(\large \{\Omega, F_{\Omega}\} \ 为可定义\ p.\ f.\ 的\ Measurable\ Space\),
\(\large 则三元组\{\Omega, F_{\Omega}, \Phi \}为\bm{ Statistical\ Model },\ 按是否取决于参数变量分两类\)
- \(\large \bm{ 参数统计模型 }:若 \bm{ 概率分布族 \Phi } \text{ 取决于某一} \ \bm{ \theta(Parameter\ Variable) }\)
$\large \Phi =\{ P(\theta) | \theta \in \Theta,\ where\ \Theta \text{ is the }\ \bm{ Parameter\ Space }\} $ - \(\large \bm{ 非参数统计模型 }:\ \bm{ 概率分布族 \Phi } \text{ 不取决于任何} \ \bm{Parameter\ Variable}\)
- 乘积模型 和 重复抽样模型
\(\large 设\ \{\Omega, F_{\Omega}, \Phi \}\ 和 \ \{\Omega', F_{\Omega}', \Phi' \}\ 为两个\ Statistical\ Model\),
$\large 则\bm{ 乘积模型 } \{ \Omega \bigotimes \Omega', F_{\Omega} \bigotimes F_{\Omega}', \Phi \bigotimes \Phi' \} 记作 \{ \Omega, F_{\Omega}, \Phi \} \bigotimes \{\Omega', F_{\Omega}', \Phi' \} \ $- $\large n\ 个\bm{等同}的\ \{\Omega, F_{\Omega}, \Phi \}\ 的\bm{乘积模型}称 \bm{ 重复抽样模型 },记为\{ \Omega, F_{\Omega}, \Phi \}^n $
- \(\large \bm{乘积模型} \text{ 实际等于 }\bm{独立观察系统}\)
- $\large \bm{重复抽样模型} \text{ 等于 }\bm{对一个观测对象} \text{ 进行 }\bm{有限次独立抽样结果} \text{ 的 }\bm{描述} $。
3.1.2 Sampling Design
\(\large \text{ Results from } \bm{probability\ theory} \text{ and } \bm{statistical\ theory} \text{ are } ,\)
\(\large employed\ to\ \bm{guide\ practice\ of\ sampling}.\)
\(\large Random\ Sampling\)(随机抽样, 简称抽样):
\(\large \text{ for } \bm{observing\ the\ elements\ of\ Population\ X },\)
\(\large 由其 \text{ 按照 } \bm{一定的概率} 抽取 \bm{\ Some\ Individuals}\).
\(\large Random\ Sample\)(随机样本, 简称样本):
\(\large 按照\bm{一定的概率}由Population \ \bm{X} =\{ x_i \},\ i \in [1, N] 抽取\bm{作为总体代表}\ 的\)
\(\large \bm{\ Some\ Individuals\ 的集合} \ \\{ X_1, X_2, \dots , X_n \\},\ n<N,\)
\(\large\ 称为\ \bm{ 容量为\ n\ 的Sample\ X} \ \\{ X_i \\}, \ i \in [1, n]\)
讨论
- 构成某一样本的每一个体都必须取自某一特定的统计总体,
不允许该总体之外的个体计入该总体的样本; - 样本个体的抽取应是按一定的概率进行的,而具体样本的产生应是随机的,
因此必须排除 人的主观因素 对 样本个体、抽取 和 样本生成 的干扰; - Sample是Population的代表,带有其 Distribution 信息;
- 因而, 能够 推断Population的Distribution规律;
- 然而,Sample只是Population的一个subset, 有随机性;
因此,由Sample推断Population, 会产生 代表性误差。
\(\large Random\ Sampling\)的优点
\(\large Random\ Sampling\)是按照 Probability 来进行的,
即 Population 的任一 Individual 都按照 某一特定的Probability 有可能被选择,
产生的 Sample 的组成 因此是 随机的。
- 客观: 可避免抽样者有意或无意的偏好;
- 经济: 以尽可能小容量的Sample 来实现对Population 尽可能客观的Statistical Inference;
- 容差: 可较好地估计出由Sampling Method带来的Error;
- 可控: 可根据对Sampling Error的要求来设计Sample Size。
- 工业化革命的直接产物: 大规模制造要求标准化设计和制造,
对制造过程的质量控制, 直接诞生了统计抽样思想和技术.
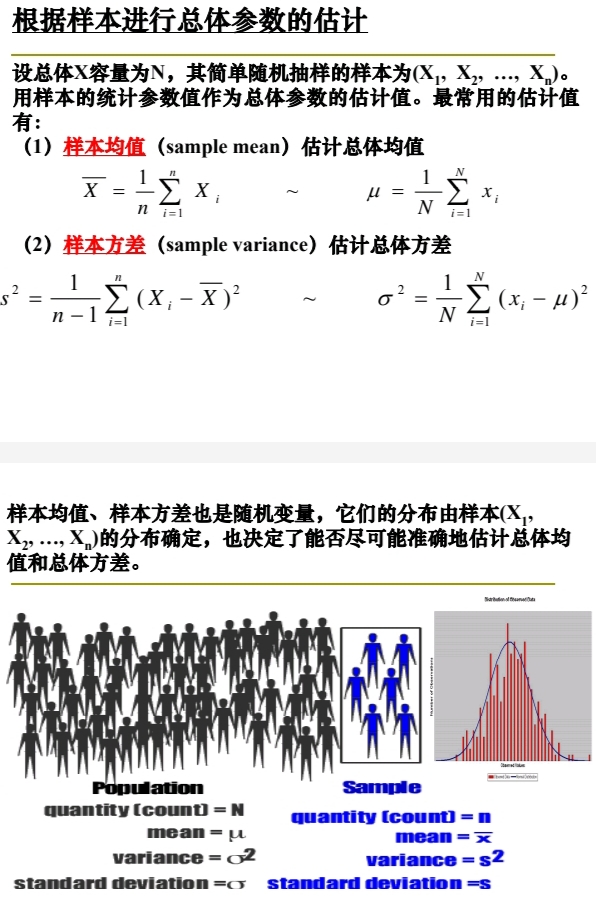
根据 Statistics of Samples 对 Parameters of Population 进行 Estimation估计
\(\large \begin{array}{ll} \\ \text{ based on Statics of Samples estimate Parameters of Population } \\ \text{ hypothesis, } Population\ Size = N, \\ \text{ a }Simple\ Random\ Sample \text{ is } (X_1,\ X_2,\ \cdots,\ X_n), \\ Statistics\ of\ Samples \text{ as } estimate\ value \text{ of } Parameters\ of\ Population. \\ \\ \text{ Some }\ usually\ used\ estimations \text{ are }: \\ \end{array}\)
\(\large (1)\ Sample\ mean \text{ estimate } Population\ mean\)
\(\large \begin{array}{ll} \bm{ \overset{-}{X} } = \dfrac{1}{n} \overset{n}{\underset{i=1}{\sum}} {X_i} & \sim & \bm{ \mu } = \dfrac{1}{N} \overset{N}{\underset{i=1}{\sum}} {x_i} \end{array}\)
\(\large (2)\ Sample\ variance \text{ estimate } Population\ variance\)
\(\large \begin{array}{ll} \bm{ s^2 } = \dfrac{1}{n-1} \overset{n}{\underset{i=1}{\sum}} { ( X_i - \overset{-}{X} )^2 } & \sim & \bm{ \sigma^2 } = \dfrac{1}{N} \overset{N}{\underset{i=1}{\sum}} { (x_i - \mu)^2 } \end{array}\)
\(\large Sample\ mean\) and \(\large Sample\ variance\) are also \(\large Random\ Variables\),
their $\large Distribution $ are determined by the $\large Distribution $ of \(\large Sample\ (X_1,\ X_2,\ \cdots,\ X_n)\) that also determines if we can estimate the \(\large Population\ mean\) and \(\large Population\ variance\) as accurate as possible。
\(\large \begin{array}{rrll} \\
\bm{ Population } & \bm{ Parameters } & \bm{ Statistics } & \bm{ Sample } \\
quantity(count)\ =& \bm{ N } & \bm{ n } &=\ quantity (count) \\
mean\ =& \bm{ \mu } & \bm{ \overset{-}{x} } &=\ mean \\
variance \ =& \bm{ \sigma^2 } & \bm{ s^2 } &=\ variance \\
standard\ deviation \ =& \bm{ \sigma } & \bm{ s } &=\ standard\ deviation \\
\end{array}\)
Example:
- \(\large X_{\theta_1} \sim {\mathcal {N}}(\mu_1 ,\sigma_1 ^{2})\)
- \(\large X_{\theta_2} \sim {\mathcal {N}}(\mu_2 ,\sigma_2 ^{2})\)
- parameter vector is \(\large \theta = [\mu, \sigma^{2}]\)


