
SciTech-Mathmatics-Probability+Statistics: Statistical Inference统计推断- Estimation估计 + Testing Hypotheses假设检验
Stat 345(April 11, 2019)
Chapter 7: Sampling Distributions and Point Estimation ofParameters
Topics:
- General concepts of
estimatingthe parameters of a population or a probability distribution Understandthe CLT(Central Limit Theorem)Explainimportant properties of point estimators,includingbias,variance, and mean square error
Overview
Identifya population of interest — for example, UNM freshmen female students' weight, height or entrance GPA.- Population parameters — unknown quantities of the population that are of interest, say,
population mean µ and population variance σ2 etc. - Random sample —- Select a random or representative sample from the population.
— A sample consists random variables Y1, · · · , Yn, that follows aspecified distribution, say N(µ, σ2) - Statistic: a function of radom variables Y1, . . . , Yn, which does not depend on any unknown parameters
-
- Observed sample: y1, y2, · · · , yn are observed sample values after data collection
-
- We cannot see much of the population —- but would like to know what is typical in the population
— The only information we have is that in the sample.
- We cannot see much of the population —- but would like to know what is typical in the population
Goal: want to use the sample information to make inferences about the population and its parameters.
- Statistical inference is concerned with making decisions about apopulation based on the information contained in a random sample from that population.
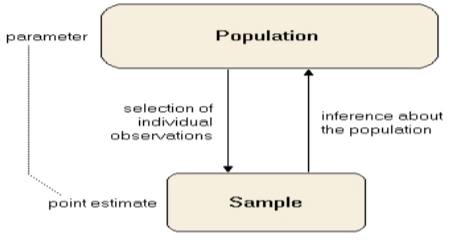
Suppose our goal is to obtain a point estimate of a population parameter,i.e. mean, variance, based a sample x1, . . . , xn.
- Before we collected the data, we consider each observation as arandom variable, i.e. X1, . . . , Xn.
- We assume X1, . . . , Xn are mutually independent random variables.
Point estimator: a point estimator is a function of X1, . . . , Xn.
Point estimate: a point estimate is a single numerical value of the point estimator based on an observed sample.
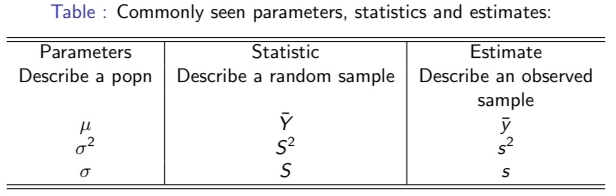
- Population mean: µ
- Sample mean: ¯ Y=Pni=1 Yi/n
- Estimate of sample mean: the value of ¯ Y computed from data y=Pni=1 yi/n¯
- Population variance: σ2I Sample variance: S2 =1n−1Pni=1(Yi − ¯ Y)2
- Estimate of sample variance: the value of S2 computed from data s2 =1y)2n−1Pni=1(yi − ¯
- Population standard deviation: σ
- I Sample standard deviation (Standard error): S
- Estimate of standard error: s, the value of S computed from data
-
北京大学工学院 的 统计概率课件PPT
http://www2.coe.pku.edu.cn/tpic/file/20150430/201504300248004545.pdf
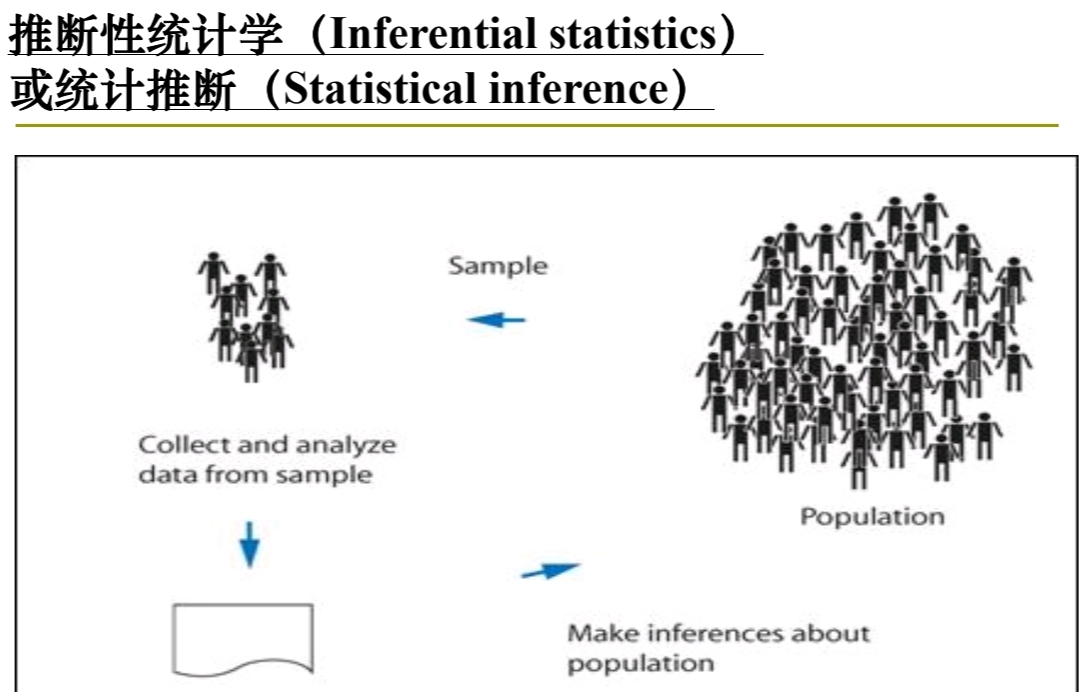

Statistical Inference:
What is SI(统计推断)
SI(统计推断) 是统计学、数据分析和数据科学领域的一个基本概念,
是 样本推导出的数据与 更广大总体的参数之间的桥梁。
它涉及使用由样本推导出的数据 对 更大的群(总)体 进行 概括或预测。
因为它能得出有意义的结论,而无需分析整个总体(这通常是不可能的)。
SI(统计推断) 依赖于 Probability Theory(概率论的原理),
使从业者能够quantify uncertainty(量化不确定性)**并根据 经验与证据 做出 理智的决策.
SI(统计推断)的类型
SI(统计推断) 主要有两种类型:
-
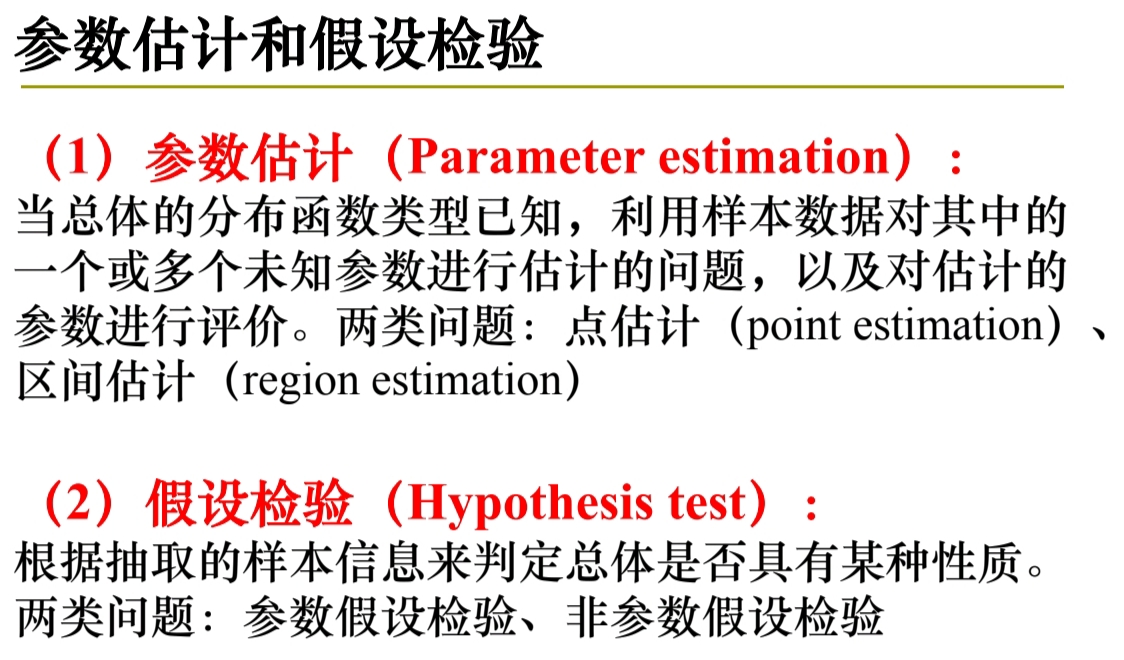
Estimation: 根据样本数据确定总体的特征;
- Point Estimation: 提供 总体的参数 的 单一值估计;
- Confidence Interval: 提供 可能包含该参数 的 一系列值(包括区间),
反映抽样固有的不确定性。
-
Testing Hypothesis: 一种用于检验 有关总体参数 的 假设或主张 的方法。
- H0: Null Hypothesis
- HA: Alternative Hypothesis
然后** 使用样本数据** 确定 是否有足够的证据 能 拒绝H0(零假设) 而 支持HA(备择假设)。
统计推断的应用
统计推断在各个领域都有广泛的应用,包括医疗保健、社会科学、营销和金融。例如,在医疗保健领域,研究人员使用统计推断根据临床试验数据确定新疗法的有效性。在营销领域,企业通过调查和实验分析消费者行为,以根据数据做出有关产品发布和广告策略的决策。从样本数据中得出有效结论的能力对于在这些领域和许多其他领域做出明智的决策至关重要。
统计推断的局限性
虽然统计推断是一种强大的工具,但它并非没有局限性。一个显著的局限性是依赖于样本代表总体的假设。如果样本有偏差或不是随机选择的,则得出的推断可能无效。此外,统计推断通常假设数据遵循特定分布,例如正态分布,但在实践中可能并不总是成立。研究人员必须谨慎解释并考虑其分析的背景,以避免得出误导性结论。
结论
统计推断是数据分析和科学研究的基石,使从业者能够根据样本数据做出明智的决策。通过理解估计、假设检验的原理以及 p 值和置信区间的相关概念,研究人员可以从有限的数据中有效地得出有关总体的结论。尽管统计推断存在局限性,但它仍然是提取见解和指导各个领域决策的重要工具。
Estimation
点估计
点估计是一种基于样本数据提供对总体参数的最佳猜测的技术。例如,如果研究人员想要估计某个城市成年男性的平均身高,他们可能会抽取一些男性样本并计算平均身高。这个平均值可作为人口平均身高的点估计值。但是,如果点估计不考虑数据中的变异性,则可能会产生误导。因此,它通常伴随着置信区间,从而更全面地反映出估计的可靠性。
置信区间
置信区间是统计推断的重要组成部分,它提供了人口参数可能落入的一系列值。例如,如果成年男性平均身高的 95% 置信区间计算为 (175 cm, 180 cm),则表明真实平均身高在此范围内的概率为 95%。置信区间的宽度受样本大小和数据变异性的影响;样本越大,区间越窄,表明估计值越精确。了解置信区间对于解释统计分析结果和做出明智决策至关重要。
Testing Hypothesis
假设检验
假设检验是一种系统方法,用于评估有关总体参数的主张。它首先要制定两个相互竞争的假设:零假设 (H0),表示没有影响或没有差异的陈述,以及备择假设 (H1),表示存在影响或差异。研究人员收集样本数据并进行统计测试,以确定证据是否足以拒绝零假设。常见的测试包括 t 检验、卡方检验和方差分析,每种方法都适用于不同类型的数据和研究问题。
P 值和显著性水平
在假设检验中,p 值在确定结果的显著性方面起着至关重要的作用。p 值表示假设零假设为真,获得至少与观察到的结果一样极端的结果的概率。p 值越小,反对零假设的证据就越强。研究人员通常将 p 值与预定的显著性水平 (alpha) 进行比较,该水平通常设置为 0.05。如果 p 值小于 alpha,则拒绝零假设,表明观察到的效应具有统计显著性。了解 p 值对于解释假设检验的结果和得出数据驱动的结论至关重要。
假设检验中的错误类型
统计推断并非没有缺陷,特别是在假设检验中,可能会出现两种类型的错误:第一类错误和第二类错误。当错误地拒绝零假设时,就会发生第一类错误,从而得出假阳性结论。相反,当零假设实际上是错误的,但未被拒绝时,就会发生第二类错误,从而错失识别真实效应的机会。在实验设计和统计结果解释中,平衡这些错误的风险是一个关键的考虑因素。


【推荐】国内首个AI IDE,深度理解中文开发场景,立即下载体验Trae
【推荐】编程新体验,更懂你的AI,立即体验豆包MarsCode编程助手
【推荐】抖音旗下AI助手豆包,你的智能百科全书,全免费不限次数
【推荐】轻量又高性能的 SSH 工具 IShell:AI 加持,快人一步
· winform 绘制太阳,地球,月球 运作规律
· 超详细:普通电脑也行Windows部署deepseek R1训练数据并当服务器共享给他人
· 上周热点回顾(3.3-3.9)
· TypeScript + Deepseek 打造卜卦网站:技术与玄学的结合
· AI 智能体引爆开源社区「GitHub 热点速览」