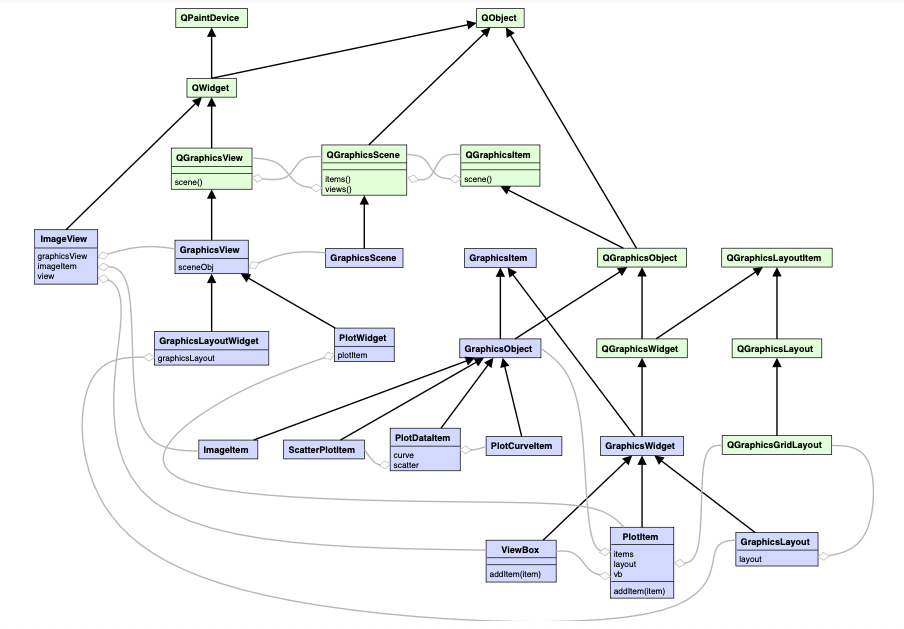
SciTech-CG-Graphics-Chart-CodeGenerator-PyQtGraph: 基于PyQt的图形绘制以及应用库: UML ClassDiagram/ FlowChart/StateMachine/正向与反向工程自动生成图或代码
UML class diagram:
A pure-python graphics and GUI library built on PyQt / PySide and numpy for use in mathematics / scientific / engineering applications.
https://pyqtgraph.readthedocs.io/en/latest/
https://pyqtgraph.readthedocs.io/en/latest/api_reference/uml_overview.html
py2uml:
https://pypi.org/project/py2puml/
FlowChart:
https://pyqtgraph.readthedocs.io/en/latest/api_reference/flowchart/index.html
The State Machine Framework¶:
https://doc.qt.io/qtforpython-5/overviews/statemachine-api.html

PyQtGraph:
What is pyqtgraph?
PyQtGraph is a graphics and user interface library for Python that provides functionality commonly required in engineering and science applications. Its primary goals are:
-
- to provide fast, interactive graphics for displaying data (plots, video, etc.) and
-
- to provide tools to aid in rapid application development (for example, property trees such as used in Qt Designer).
PyQtGraph makes heavy use of the Qt GUI platform(via PyQt or PySide) for its high-performance graphics and numpy for heavy number crunching. In particular, pyqtgraph uses Qt’s GraphicsView framework which is a highly capable graphics system on its own; we bring optimized and simplified primitives to this framework to allow data visualization with minimal effort.
It is known to run on Linux, Windows, and OSX
What can it do?
Amongst the core features of pyqtgraph are:
- Basic data visualization primitives: Images, line and scatter plots
- Fast enough for realtime update of video/plot data
- Interactive scaling/panning, averaging, FFTs, SVG/PNG export
- Widgets for marking/selecting plot regions
- Widgets for marking/selecting image region-of-interest and automatically slicing multi-dimensional image data
- Framework for building customized image region-of-interest widgets
- Docking system that replaces/complements Qt’s dock system to allow more complex (and more predictable) docking arrangements
- ParameterTree widget for rapid prototyping of dynamic interfaces (Similar to the property trees in Qt Designer and many other applications)
Examples
PyQtGraph includes an extensive set of examples that can be accessed by running either python -m pyqtgraph.examples or
import pyqtgraph.examples
pyqtgraph.examples.run()
This will start a launcher with a list of available examples. Select an item from the list to view its source code and double-click an item to run the example.
Python自动绘制UML类图、函数调用图(Call Graph)
1. 引言
在设计软件、分析代码时,我们常常会借助UML以及函数调用图,来帮自己梳理思路。
尤其是遇到bug时,借助这些可视化手段,也可以帮你在调试过程中发现逻辑错误。
本文主要介绍以下两个方法:
- 用 graphviz+pyreverse,自动提取 python代码 的UML类图和包依赖关系。
- 用 graphviz+pycallgraph,自动提取 python代码 的动态调用流程图。
2. 绘制UML类图
2.1 安装 graphviz:
Graphviz 是一个开源图形可视化软件。Graphviz 以简单的文本语言对图形进行描述,并用多种格式制作图表,例如SVG(网页图像),Postscript(包含在 PDF 或其他文档的图片) ;或png/jpg(交互式图形浏览器显示)。
- 官网安装graphviz: http://www.graphviz.org/download/
下载exe安装包,完成graphviz软件安装,并找到bin路径。 - 设置环境变量:将 bin 路径添加到 PATH
- 安装对应python库:
$ pip install graphviz
2.2 安装pyreverse(直接安装pylint因为其已经包含pyreverse)
- pyreverse: 用于对 Python 代码进行逆向工程的实用程序。
可以分析Python代码并提取 UML 类图和包依赖关系:
* 类属性,及其类型
* 类方法
* 类之间的继承链接
* 类之间的关联链接
* 异常和接口的表示 - 安装pylint:
$ pip install pylint
2.3 安装 pycallgraph: $ pip install pycallgraph
2.3 绘制UML类图
UML类图常用于面向对象的建模,UML类图的每个方框是一个对象类, 每个框从上到下分为三部分:
- 第一部分是对象类名称
- 第二部分是类的属性
- 第三部分是类的函数。
在Shell输入语句,生成package的UML图:
$ pyreverse --help # 常用选项有:
  # -o :设置保存图像的格式,如png, dot, puml, plantuml, mmd, html
  # -p Name: 输出图形以packages_<PROJECT_NAME>.png为名称保存
  # -m <y or n>, --module-names <y or n>
  # -p <project name>, --project <project name>
  # --colorized,  --max-color-depth <depth>, --color-palette <color1,color2,...>
$ pyreverse -o dot  -p Pyreverse  -m y  --colorized  ../whoosh/
[...]
creating diagram packages_Pyreverse.dot
creating diagram classes_Pyreverse.dot
[...]
3. 绘制函数调用图
pycallgraph是对python代码进行动态调用图分析的python模块。包括模块之间的调用流程、函数调用次数及用时。
函数调用图(Call Graph)是一个控制流程图,用于表示程序d的各单元之间的调用关系。每个节点之间的边缘表示调用过程。循环曲线表示递归过程调用。
绘制Call Graph常用的有:pycallgraph、pyan(静态调用图)、gprof2dot 、code2flow等。本文介绍pycallgraph的用法。
3.1 安装: $ pip install pycallgraph graphviz
3.2 使用示例
-
Shell 调用:
$ pycallgraph graphviz -- ./mypythonscript.py -
API 调用: 直接在要分析的函数调用前,加上
with PyCallGraph(output=GraphvizOutput())::
from pycallgraph import PyCallGraph
from pycallgraph.output import GraphvizOutput
with PyCallGraph(output=GraphvizOutput()):
# 调用你要分析的函数
code_to_profile()
      如果需要指定调用图中包含(include) 哪些函数、排除(exclude)哪些函数,
      就要用到GlobbingFilter(include=[....])、GlobbingFilter(exclude=[....]),例如这样:
from pycallgraph import PyCallGraph
from pycallgraph.output import GraphvizOutput
from pycallgraph import Config
from pycallgraph import GlobbingFilter
def main():
# TODO: 调用各种类、函数
return
if name == "main":
config = Config()
# 调用图中包括(include)哪些函数
# 用moduleName.表示,包含某个模块内的所有函数
config.trace_filter = GlobbingFilter(include=[
'main',
'app.',
'widgets.list_widget.',
'utils.RegionInfo.'
])
# 调用图中不包括(exclude)哪些函数
# config.trace_filter = GlobbingFilter(exclude=[
#     'moduleA.*',
#     'moduleB.*',
#     '*.funcB'
# ])

graphviz = GraphvizOutput()
graphviz.output_file = 'graph.png'
with PyCallGraph(output=graphviz, config=config):
    main()
在程序正常运行完之后,就会在当前路径生成graph.png文件。
越复杂程序,生成的调用图就会越大,注意选取你focus的函数进行可视化。

其他高级用法可以参考官方文档:`https://pycallgraph.readthedocs.io/en/master/`


