
二进制安装kubernetes v1.11.2 (第十七章 dashboard 部署)
继续前一章部署。
dashboard 部署
17.1 下载和分发二进制文件,参考 第三章
# 解压二进制文件
[root@k8s-m1 ~]# cd ~/k8s/v1.11.2/kubernetes/
[root@k8s-m1 kubernetes]# tar zxvf kubernetes-src.tar.gz
[root@k8s-m1 yaml]#  cd ~/k8s/v1.11.2/kubernetes/cluster/addons/dashboard/


# 修改  dashboard-controller.yaml
[root@k8s-m1 dashboard]# cp dashboard-controller.yaml dashboard-controller.yaml.orig
[root@k8s-m1 dashboard]# diff dashboard-controller.yaml{,.orig}
34,35c34
<         #image: k8s.gcr.io/kubernetes-dashboard-amd64:v1.8.3
<         image: registry.cn-shenzhen.aliyuncs.com/kubernetes-dashboard-amd64:v1.8.3
---
>         image: k8s.gcr.io/kubernetes-dashboard-amd64:v1.8.3

# 关于  dashboard-controller.yaml 的修改,也可以用另外一种不修改 yaml 的方法。
# 即:先在节点上 download dashboard 的镜像,然后修改 tag 后直接执行 yaml 文件
# 先看一下 yaml 里面 image 的值:
[root@k8s-m1 dashboard]# grep image dashboard-controller.yaml
        image: k8s.gcr.io/kubernetes-dashboard-amd64:v1.8.3
# 然后下载并修改 tag
[root@k8s-m2 ~]# docker pull registry.cn-hangzhou.aliyuncs.com/kube_containers/kubernetes-dashboard-amd64:v1.8.3
[root@k8s-m2 ~]# docker tag registry.cn-hangzhou.aliyuncs.com/kube_containers/kubernetes-dashboard-amd64:v1.8.3 k8s.gcr.io/kubernetes-dashboard-amd64:v1.8.3


# 修改 dashboard-service.yaml
[root@k8s-m1 dashboard]# cp dashboard-service.yaml dashboard-service.yaml.orig
[root@k8s-m1 dashboard]# diff dashboard-service.yaml.orig dashboard-service.yaml
10a11
>   type: NodePort
[root@k8s-m1 dashboard]#
17.2 执行所有定义文件
[root@k8s-m1 dashboard]# ls *.yaml
dashboard-configmap.yaml  dashboard-controller.yaml  dashboard-rbac.yaml  dashboard-secret.yaml  dashboard-service.yaml
# 执行定义的 yaml
[root@k8s-m1 dashboard]# kubectl apply -f .
configmap/kubernetes-dashboard-settings created
serviceaccount/kubernetes-dashboard created
deployment.apps/kubernetes-dashboard created
role.rbac.authorization.k8s.io/kubernetes-dashboard-minimal created
rolebinding.rbac.authorization.k8s.io/kubernetes-dashboard-minimal created
secret/kubernetes-dashboard-certs created
secret/kubernetes-dashboard-key-holder created
service/kubernetes-dashboard created
17.3 查看分配的 NodePort
[root@k8s-m1 dashboard]# kubectl get deployment kubernetes-dashboard  -n kube-system
NAME                   DESIRED   CURRENT   UP-TO-DATE   AVAILABLE   AGE
kubernetes-dashboard   1         1         1            1           6m
[root@k8s-m1 dashboard]# kubectl --namespace kube-system get pods -o wide
NAME                                    READY     STATUS    RESTARTS   AGE       IP            NODE      NOMINATED NODE
coredns-55877fc9fb-btn4p                1/1       Running   0          1h        172.30.10.3   k8s-m2    <none>
kubernetes-dashboard-69db8c7745-84vbx   1/1       Running   1          6m        172.30.10.5   k8s-m2    <none>
[root@k8s-m1 dashboard]# kubectl get services kubernetes-dashboard -n kube-system
NAME                   TYPE       CLUSTER-IP       EXTERNAL-IP   PORT(S)        AGE
kubernetes-dashboard   NodePort   10.254.127.159   <none>        443:8789/TCP   6m
- 可以修改 dashboard-service.yaml 添加一个 nodePort: 8888,指定端口
- dashboard 的 --authentication-mode 支持 token、basic,默认为 token。如果使用 basic,则 kube-apiserver 必须配置 '--authorization-mode=ABAC' 和 '--basic-auth-file' 参数
17.4 查看 dashboard 支持的命令行参数
[root@k8s-m1 dashboard]# kubectl exec --namespace kube-system -it kubernetes-dashboard-69db8c7745-84vbx  -- /dashboard --help
2018/11/14 10:15:50 Starting overwatch
Usage of /dashboard:
      --alsologtostderr                   log to standard error as well as files
      --apiserver-host string             The address of the Kubernetes Apiserver to connect to in the format of protocol://address:port, e.g., http://localhost:8080. If not specified, the assumption is that the binary runs inside a Kubernetes cluster and local discovery is attempted.
      --authentication-mode stringSlice   Enables authentication options that will be reflected on login screen. Supported values: token, basic. Default: token.Note that basic option should only be used if apiserver has '--authorization-mode=ABAC' and '--basic-auth-file' flags set. (default [token])
      --auto-generate-certificates        When set to true, Dashboard will automatically generate certificates used to serve HTTPS. Default: false.
      --bind-address ip                   The IP address on which to serve the --secure-port (set to 0.0.0.0 for all interfaces). (default 0.0.0.0)
      --default-cert-dir string           Directory path containing '--tls-cert-file' and '--tls-key-file' files. Used also when auto-generating certificates flag is set. (default "/certs")
      --disable-settings-authorizer       When enabled, Dashboard settings page will not require user to be logged in and authorized to access settings page.
      --enable-insecure-login             When enabled, Dashboard login view will also be shown when Dashboard is not served over HTTPS. Default: false.
      --heapster-host string              The address of the Heapster Apiserver to connect to in the format of protocol://address:port, e.g., http://localhost:8082. If not specified, the assumption is that the binary runs inside a Kubernetes cluster and service proxy will be used.
      --insecure-bind-address ip          The IP address on which to serve the --port (set to 0.0.0.0 for all interfaces). (default 127.0.0.1)
      --insecure-port int                 The port to listen to for incoming HTTP requests. (default 9090)
      --kubeconfig string                 Path to kubeconfig file with authorization and master location information.
      --log_backtrace_at traceLocation    when logging hits line file:N, emit a stack trace (default :0)
      --log_dir string                    If non-empty, write log files in this directory
      --logtostderr                       log to standard error instead of files
      --metric-client-check-period int    Time in seconds that defines how often configured metric client health check should be run. Default: 30 seconds. (default 30)
      --port int                          The secure port to listen to for incoming HTTPS requests. (default 8443)
      --stderrthreshold severity          logs at or above this threshold go to stderr (default 2)
      --system-banner string              When non-empty displays message to Dashboard users. Accepts simple HTML tags. Default: ''.
      --system-banner-severity string     Severity of system banner. Should be one of 'INFO|WARNING|ERROR'. Default: 'INFO'. (default "INFO")
      --tls-cert-file string              File containing the default x509 Certificate for HTTPS.
      --tls-key-file string               File containing the default x509 private key matching --tls-cert-file.
      --token-ttl int                     Expiration time (in seconds) of JWE tokens generated by dashboard. Default: 15 min. 0 - never expires (default 900)
  -v, --v Level                           log level for V logs
      --vmodule moduleSpec                comma-separated list of pattern=N settings for file-filtered logging
command terminated with exit code 2
17.5 访问 dashboard
为了集群访问安全,从1.7开始,dashboard 只允许通过 https 访问, 如果使用 kube proxy 则必须监听 localhost 或 127.0.0.1, 对于 NodePort 没有这个限制,但是仅建议在开发环境中使用。
对于不满足这些条件的登陆访问,在登陆成功后浏览器不跳转,始终停留在登陆界面。
参考:
https://github.com/kubernetes/dashboard/wiki/Accessing-Dashboard---1.7.X-and-above
https://github.com/kubernetes/dashboard/issues/2540
1.kubernetes-dashboard 服务暴露了 NodePort,可以使用 https://NodeIP:NodePort 地址访问 dashboard
2.通过 kube-apiserver 访问 dashboard
3.通过 kubectl proxy 访问 dashboard
下面介绍各种访问方式:
通过 NodePort 访问 dashboard
#浏览器打开
https://NodePort:8888/#!/login
通过 kubectl proxy 访问 dashboard
kubectl proxy --address='localhost' --port=8086 --accept-hosts='^*$'
Starting to serve on 127.0.0.1:8086
- --address 必须为 localhost 或者 127.0.0.1
- 需要制定 --accept-hosts 选项, 否则浏览器访问 dashboard 页面时提示 “Unauthorized”
- 浏览器访问URL:http://127.0.0.1:8086/api/v1/namespaces/kube-system/services/https:kubernetes-dashboard:/proxy
通过 kube-apiserver 访问 dashboard
[root@k8s-m1 dashboard]# kubectl cluster-info
Kubernetes master is running at https://192.168.56.6:8443
CoreDNS is running at https://192.168.56.6:8443/api/v1/namespaces/kube-system/services/kube-dns:dns/proxy
kubernetes-dashboard is running at https://192.168.56.6:8443/api/v1/namespaces/kube-system/services/https:kubernetes-dashboard:/proxy

To further debug and diagnose cluster problems, use 'kubectl cluster-info dump'.
- 必须通过 kube-apiserver 的安全端口(https)访问 dashboard, 访问时浏览区需要使用自定义证书,否则会被 kube-apiserver 拒绝访问
创建和导入自定义证书的步骤, 参考: https://www.cnblogs.com/aast/p/9959987.html
浏览器导入 client 证书后,再次打开 https://192.168.56.6:8443/api/v1/namespaces/kube-system/services/https:kubernetes-dashboard:/proxy 进入如下界面
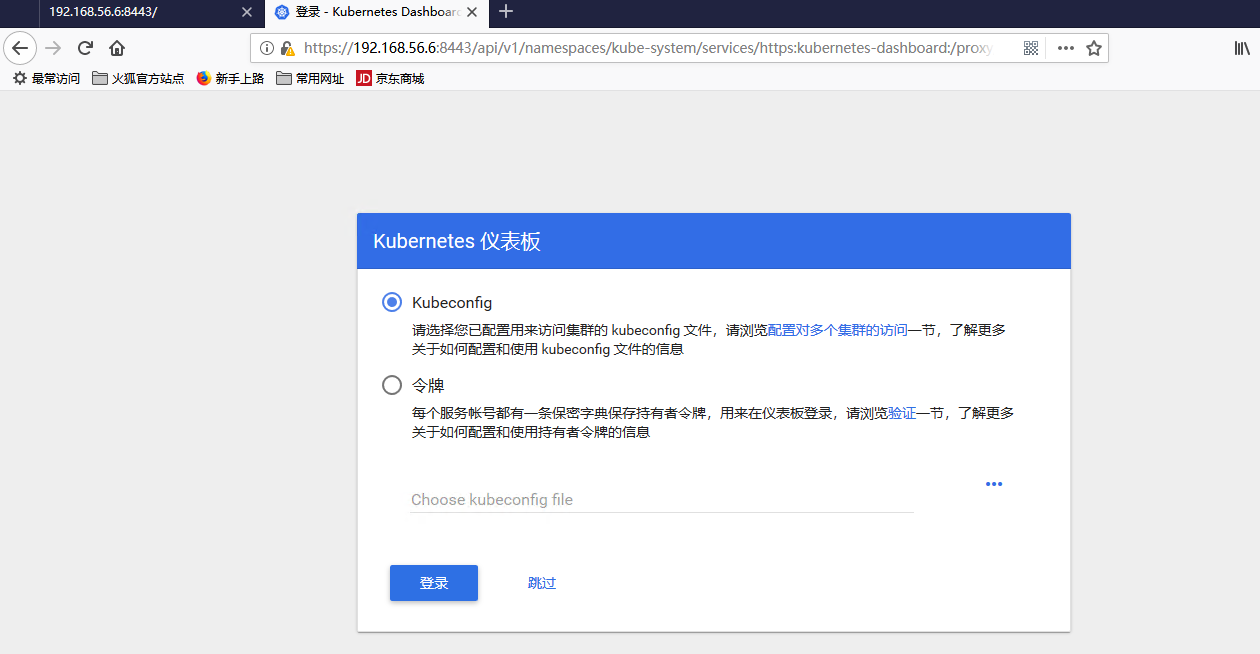
点击“跳过”,只能浏览页面,没有任何权限。必须要进行登陆设置
创建登陆 dashboard 的 token 和 kubeconfig 配置文件
上面提到,dashboard 默认只支持 token 认证,所以如果使用 kubeConfig 文件,需要在该文件中指定 token,不支持使用 client 证书认证。
创建 token
[root@k8s-m1 cert]# kubectl create sa dashboard-admin -n kube-system
serviceaccount/dashboard-admin created
[root@k8s-m1 cert]# kubectl create clusterrolebinding dashboard-admin --clusterrole=cluster-admin --serviceaccount=kube-system:dashboard-admin
clusterrolebinding.rbac.authorization.k8s.io/dashboard-admin created
[root@k8s-m1 cert]# ADMIN_SECRET=$(kubectl get secrets -n kube-system | grep dashboard-admin | awk '{print $1}')
[root@k8s-m1 cert]# DASHBOARD_LOGIN_TOKEN=$(kubectl describe secret -n kube-system ${ADMIN_SECRET} | grep -E '^token' | awk '{print $2}')
[root@k8s-m1 cert]# echo ${DASHBOARD_LOGIN_TOKEN}
eyJhbGciOiJSUzI1NiIsImtpZCI6IiJ9.eyJpc3MiOiJrdWJlcm5ldGVzL3NlcnZpY2VhY2NvdW50Iiwia3ViZXJuZXRlcy5pby9zZXJ2aWNlYWNjb3VudC9uYW1lc3BhY2UiOiJrdWJlLXN5c3RlbSIsImt1YmVybmV0ZXMuaW8vc2VydmljZWFjY291bnQvc2VjcmV0Lm5hbWUiOiJkYXNoYm9hcmQtYWRtaW4tdG9rZW4tdGpsaG0iLCJrdWJlcm5ldGVzLmlvL3NlcnZpY2VhY2NvdW50L3NlcnZpY2UtYWNjb3VudC5uYW1lIjoiZGFzaGJvYXJkLWFkbWluIiwia3ViZXJuZXRlcy5pby9zZXJ2aWNlYWNjb3VudC9zZXJ2aWNlLWFjY291bnQudWlkIjoiMDcwZDU4NjQtZTgwYy0xMWU4LWE3NTAtMDgwMDI3Njc1YmMxIiwic3ViIjoic3lzdGVtOnNlcnZpY2VhY2NvdW50Omt1YmUtc3lzdGVtOmRhc2hib2FyZC1hZG1pbiJ9.U1HU_PfkGUzTWg1ZBDbBZaliL7hnHxtKgCkC4rZeNbo8L5BAIzLIIkWXGtRbkJPbvQGVNiGr4S6g6jlNVzOfgTzIltwd-w8dFL-DuX7oBmnyF3qh7STQE8T2iEyGc9NOTOx6HugH-UZdwEEQMidYVqH3qdsTn7WMTcdg-Q1qH_Ob8vsAr-0s7a-wDbvgn_ua_ArF9Z26C8D6M893xV7aDRhXZ0Xr-r27I6ztAwCFkVIxgotTAsFNhGOre4D2kHMzgQTAF2n55GUmkdt4jti2Zbhm0Mk6W6yArAEMsbB4PZUY4OEpEcgevomdgLcwOO8K6VV4ybFY0CakbfCRBQe8kQ
使用上面输出的 tokne 可以登陆 dashboard
# 继续使用上面生成的token。 创建使用 token 的 KubeConfig 文件

source /opt/k8s/bin/environment.sh
# 设置集群参数
kubectl config set-cluster kubernetes \
  --certificate-authority=/etc/kubernetes/cert/ca.pem \
  --embed-certs=true \
  --server=${KUBE_APISERVER} \
  --kubeconfig=dashboard.kubeconfig

# 设置客户端认证参数,使用上面创建的 Token
kubectl config set-credentials dashboard_user \
  --token=${DASHBOARD_LOGIN_TOKEN} \
  --kubeconfig=dashboard.kubeconfig

# 设置上下文参数
kubectl config set-context default \
  --cluster=kubernetes \
  --user=dashboard_user \
  --kubeconfig=dashboard.kubeconfig

# 设置默认上下文
kubectl config use-context default --kubeconfig=dashboard.kubeconfig
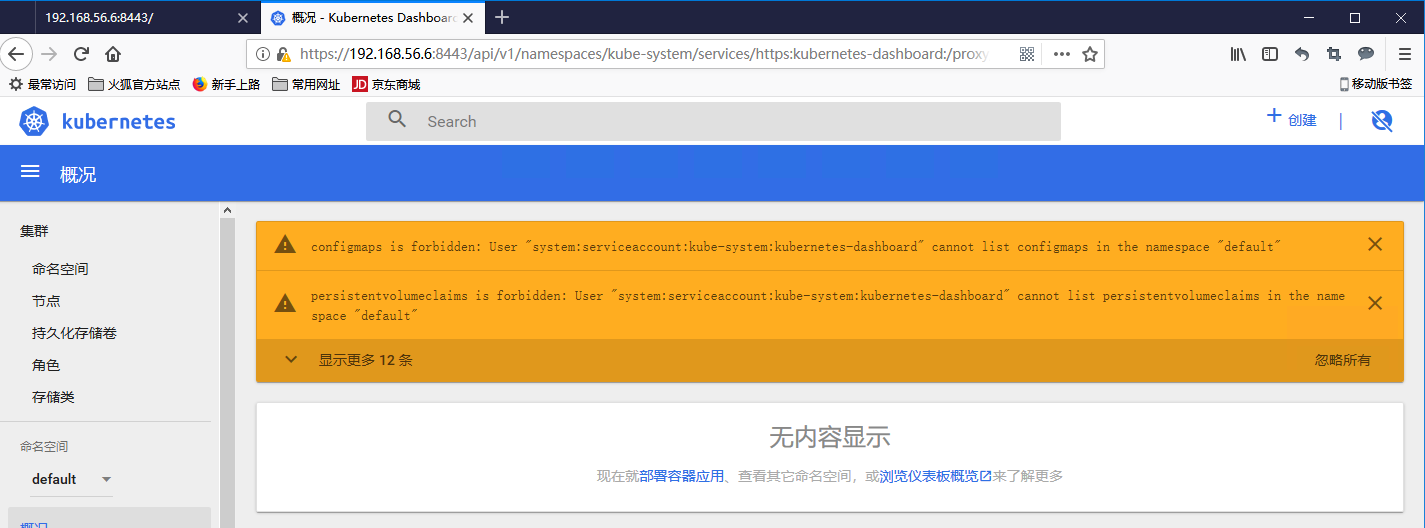
登陆后的页面
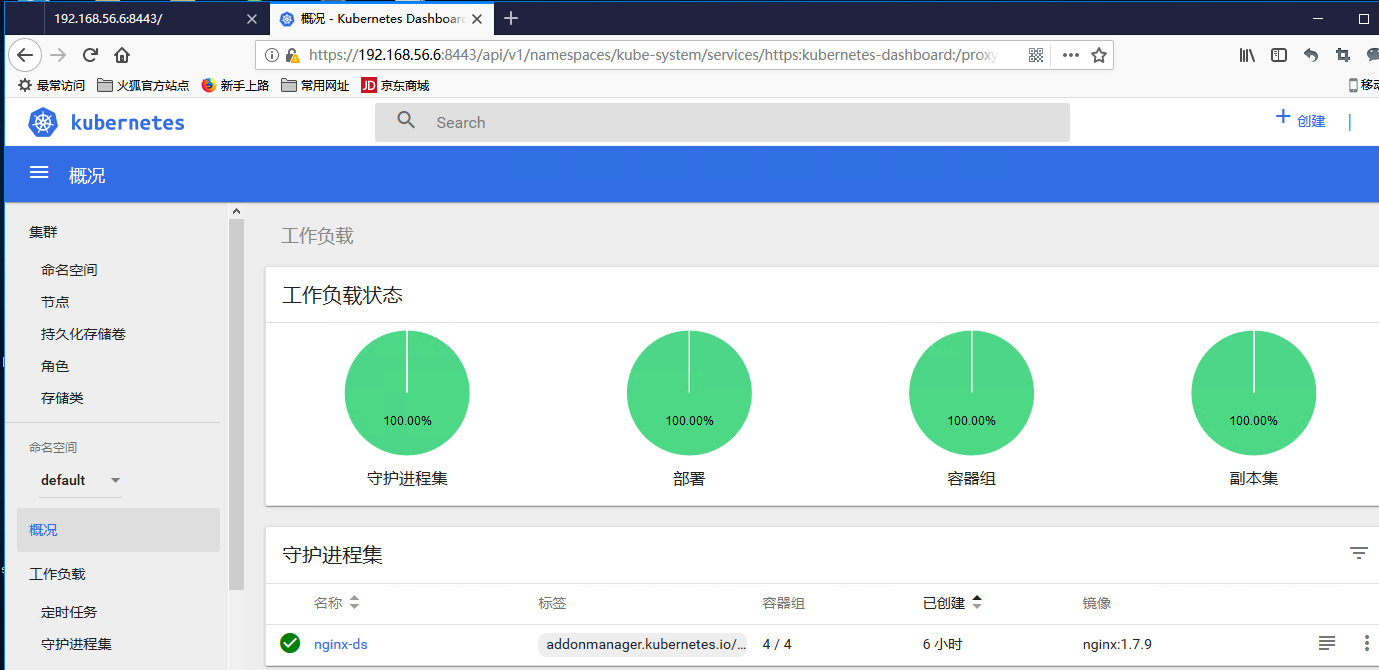
由于缺少 Heapster 插件,当前的 dashboard 不能展示 Pod、Nodes 的 cpu、内存等统计数据
参考
https://github.com/opsnull/follow-me-install-kubernetes-cluster/blob/master/09-2.dashboard%E6%8F%92%E4%BB%B6.md#%E9%80%9A%E8%BF%87-kubectl-proxy-%E8%AE%BF%E9%97%AE-dashboard
https://github.com/kubernetes/dashboard/wiki/Access-control https://github.com/kubernetes/dashboard/issues/2558
https://kubernetes.io/docs/concepts/configuration/organize-cluster-access-kubeconfig/


 浙公网安备 33010602011771号