import numpy as np
from sklearn.datasets import load_iris
iris = load_iris()
x=iris.data[:,1]
y=np.zeros(150)
k=3
def initcent(x,k):
return x[0:k].reshape(k)
def nearest(kc,i):#数组中的值,与聚类中心最小距离所在类型的索引号
d=(abs(kc-i))
w=np.where(d == np.min(d))
return w[0][0]
def kcmean(x,y,kc,k): #计算各聚类新均值
l=list(kc)
flag= False
for c in range(k):
print(c)
m=np.where(y == c)
# print(m,x[m])
n = np.mean(x[m])
# print(kc[c],n)
if l[c] !=n:
# kc[c] = n
# print(type(kc),kc[c])
l[c] = n
flag = True
print(l,flag)
return (np.array(l),flag)
def xclessify(x,y,kc):
for i in range(x.shape[0]):# 对数组的每个值分类
y[i] = nearest(kc,x[i])
return y
kc=initcent(x,k)
flag = True
print(x,y,kc,flag)
while flag:
y = xclessify(x, y, kc)
kc,flag=kcmean(x,y,kc,k)
print(y,kc)
import matplotlib.pyplot as plt
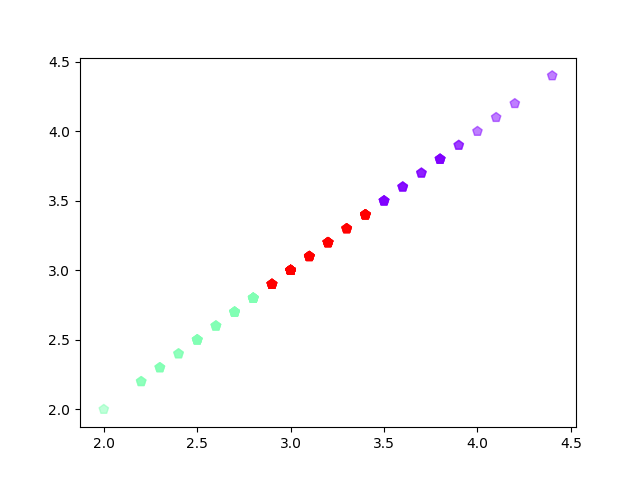
plt.scatter(x,x,c=y,s=50,cmap='rainbow',marker='p',alpha=0.5);
plt.show()
C:\Users\Administrator\PycharmProjects\untitled1\venv\Scripts\python.exe C:/Users/Administrator/Desktop/kjbfdsaf.py
C:\Users\Administrator\PycharmProjects\untitled1\venv\lib\site-packages\sklearn\externals\joblib\externals\cloudpickle\cloudpickle.py:47: DeprecationWarning: the imp module is deprecated in favour of importlib; see the module's documentation for alternative uses
  import imp
[3.5 3.  3.2 3.1 3.6 3.9 3.4 3.4 2.9 3.1 3.7 3.4 3.  3.  4.  4.4 3.9 3.5
 3.8 3.8 3.4 3.7 3.6 3.3 3.4 3.  3.4 3.5 3.4 3.2 3.1 3.4 4.1 4.2 3.1 3.2
 3.5 3.6 3.  3.4 3.5 2.3 3.2 3.5 3.8 3.  3.8 3.2 3.7 3.3 3.2 3.2 3.1 2.3
 2.8 2.8 3.3 2.4 2.9 2.7 2.  3.  2.2 2.9 2.9 3.1 3.  2.7 2.2 2.5 3.2 2.8
 2.5 2.8 2.9 3.  2.8 3.  2.9 2.6 2.4 2.4 2.7 2.7 3.  3.4 3.1 2.3 3.  2.5
 2.6 3.  2.6 2.3 2.7 3.  2.9 2.9 2.5 2.8 3.3 2.7 3.  2.9 3.  3.  2.5 2.9
 2.5 3.6 3.2 2.7 3.  2.5 2.8 3.2 3.  3.8 2.6 2.2 3.2 2.8 2.8 2.7 3.3 3.2
 2.8 3.  2.8 3.  2.8 3.8 2.8 2.8 2.6 3.  3.4 3.1 3.  3.1 3.1 3.1 2.7 3.2
 3.3 3.  2.5 3.  3.4 3. ] [0. 0. 0. 0. 0. 0. 0. 0. 0. 0. 0. 0. 0. 0. 0. 0. 0. 0. 0. 0. 0. 0. 0. 0.
 0. 0. 0. 0. 0. 0. 0. 0. 0. 0. 0. 0. 0. 0. 0. 0. 0. 0. 0. 0. 0. 0. 0. 0.
 0. 0. 0. 0. 0. 0. 0. 0. 0. 0. 0. 0. 0. 0. 0. 0. 0. 0. 0. 0. 0. 0. 0. 0.
 0. 0. 0. 0. 0. 0. 0. 0. 0. 0. 0. 0. 0. 0. 0. 0. 0. 0. 0. 0. 0. 0. 0. 0.
 0. 0. 0. 0. 0. 0. 0. 0. 0. 0. 0. 0. 0. 0. 0. 0. 0. 0. 0. 0. 0. 0. 0. 0.
 0. 0. 0. 0. 0. 0. 0. 0. 0. 0. 0. 0. 0. 0. 0. 0. 0. 0. 0. 0. 0. 0. 0. 0.
 0. 0. 0. 0. 0. 0.] [3.5 3.  3.2] True
0
[3.6378378378378375, 3.0, 3.2] True
1
[3.6378378378378375, 2.793617021276596, 3.2] True
2
[3.6378378378378375, 2.793617021276596, 3.2315789473684213] True
0
[3.752, 2.793617021276596, 3.2315789473684213] True
1
[3.752, 2.753012048192771, 3.2315789473684213] True
2
[3.752, 2.753012048192771, 3.245238095238096] True
0
1
[3.752, 2.6403508771929824, 3.245238095238096] True
2
[3.752, 2.6403508771929824, 3.151470588235294] True
0
1
[3.752, 2.585106382978723, 3.151470588235294] True
2
[3.752, 2.585106382978723, 3.119230769230769] True
0
1
2
[0. 2. 2. 2. 0. 0. 2. 2. 2. 2. 0. 2. 2. 2. 0. 0. 0. 0. 0. 0. 2. 0. 0. 2.
 2. 2. 2. 0. 2. 2. 2. 2. 0. 0. 2. 2. 0. 0. 2. 2. 0. 1. 2. 0. 0. 2. 0. 2.
 0. 2. 2. 2. 2. 1. 1. 1. 2. 1. 2. 1. 1. 2. 1. 2. 2. 2. 2. 1. 1. 1. 2. 1.
 1. 1. 2. 2. 1. 2. 2. 1. 1. 1. 1. 1. 2. 2. 2. 1. 2. 1. 1. 2. 1. 1. 1. 2.
 2. 2. 1. 1. 2. 1. 2. 2. 2. 2. 1. 2. 1. 0. 2. 1. 2. 1. 1. 2. 2. 0. 1. 1.
 2. 1. 1. 1. 2. 2. 1. 2. 1. 2. 1. 0. 1. 1. 1. 2. 2. 2. 2. 2. 2. 2. 1. 2.
 2. 2. 1. 2. 2. 2.] [3.752      2.58510638 3.11923077]

进程已结束,退出代码0
![]()
#3.用sklearn.cluster.KMeans,鸢尾花花瓣长度数据做聚类并用散点图显示
import numpy as np
from sklearn.cluster import KMeans
from sklearn.datasets import load_iris
import matplotlib.pyplot as plt

iris_data = load_iris()
X=iris_data.data

petal_length = X[:, 2:3]
x= petal_length
print(x)
k_means = KMeans(n_clusters=3)
est = k_means.fit(x)
kc = est.cluster_centers_
y_kmeans = k_means.predict(x)
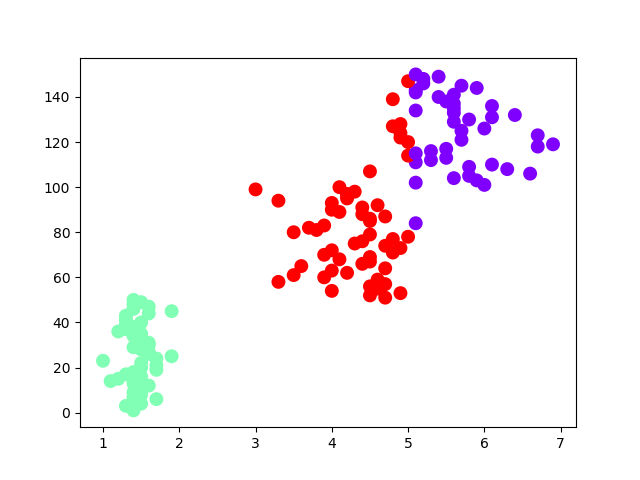
plt.scatter(x,np.linspace(1,150,150),c=y_kmeans,marker='o',cmap='rainbow',linewidths=4)
plt.show plt(1,150150),c=y_kmeans,marker='o',cmap='rainbow',linewidths=4) plt.show()![]()
import matplotlib.pyplot as plt
import numpy as np
from sklearn.datasets import load_iris
iris = load_iris()
X = iris.data
X
from sklearn.cluster import KMeans
est = KMeans(n_clusters = 3)
est.fit(X)
kc = est.cluster_centers_
y_kmeans = est.predict(X) #预测每个样本的聚类索引
print(y_kmeans,kc)
print(kc.shape,y_kmeans.shape,np.shape)
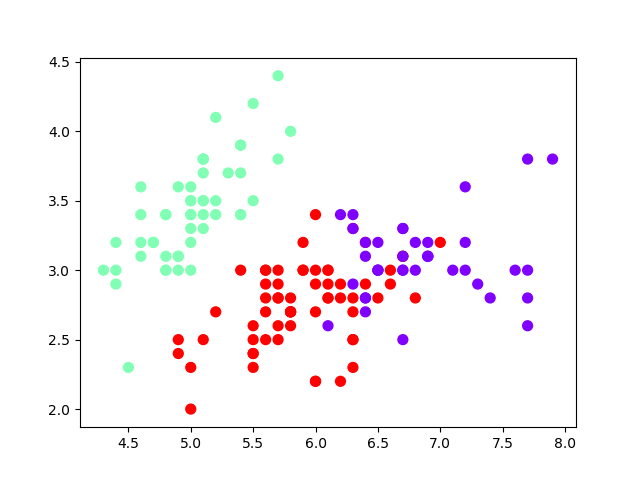
plt.scatter(X[:,0],X[:,1],c=y_kmeans,s=50,cmap='rainbow');
plt.show()
![]()


 浙公网安备 33010602011771号