
numpy统计分布显示
import numpy as np
from sklearn.datasets import load_iris
data = load_iris()
pental_len = data.data[:, 2]
# 计算鸢尾花花瓣长度的最大值,平均值,中值,均方差
print("最大值:", np.max(pental_len))
print("平均值:", np.mean(pental_len))
print("中值:", np.median(pental_len))
print("均方差:", np.std(pental_len))
# 用np.random.normal()产生一个正态分布的随机数组,并显示出来
print(np.random.normal(4, 10, 100))
print('============================================================================')
# np.random.randn()产生一个正态分布的随机数组,并显示出来
print(np.random.randn(50))
# 显示鸢尾花花瓣长度的正态分布图
import matplotlib.pyplot as plt
mu = np.mean(pental_len)
sigma = np.std(pental_len)
num = 10000
rand_data = np.random.normal(mu, sigma, num)
count, bins, ignored = plt.hist(rand_data, 30, normed=True)
plt.plot(bins, 1 / (sigma * np.sqrt(2 * np.pi)) * np.exp(-(bins - mu) ** 2 / (2 * sigma ** 2)), linewidth=2, color="r")
plt.show()
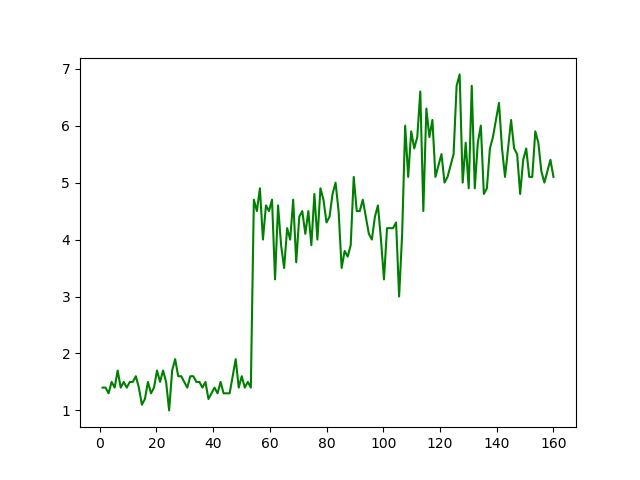
# 显示鸢尾花花瓣长度的曲线图
plt.plot(np.linspace(1, 160, num=150), pental_len, 'g')
plt.show()
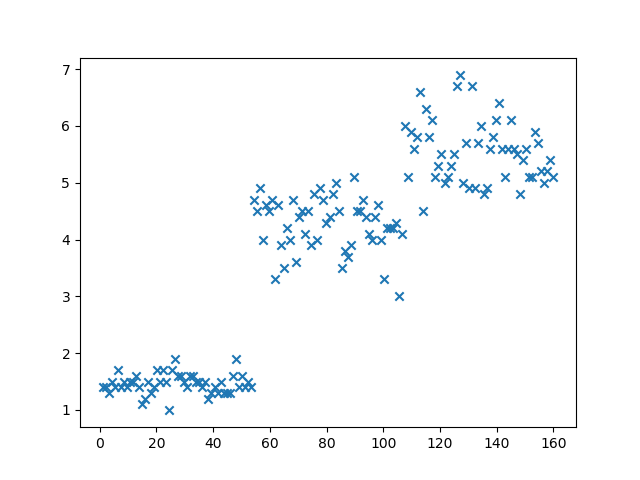
# 显示鸢尾花花瓣长度的散点图
plt.scatter(np.linspace(1, 160, num=150), pental_len, alpha=1, marker='x')
plt.show()


 浙公网安备 33010602011771号