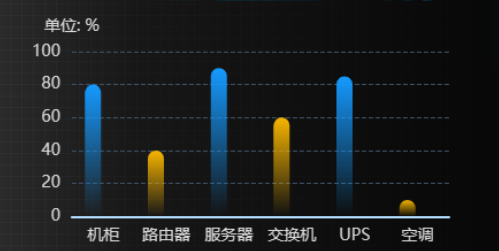
柱状图-隔行变色
效果图:

代码:
const chart = this.refs.vChartRef.chart
function upOpt() {
  chart.setOption({
    tooltip: {
      trigger: "axis",
      show: true,
      backgroundColor: "rgba(0, 0, 0, 0.4)",
      borderColor: "transparent",
      padding: [5],
      axisPointer: {
        type: "none",
      },
      textStyle: {
        color: "#FFFFFF",
        fontSize: 14,
      },
    },
    grid: {
      top: "17%",
      left: "9%",
      right: "4%",
      bottom: "15%",
    },
    xAxis: [
      {
        type: "category",
        axisLine: {
          show: true,
          lineStyle: {
            color: "#B3DFFF",
            width: 2,
          },
        },
        axisLabel: {
          show: true,
          fontSize: 14,
          fontFamily: "SourceHanSansCN-Regular",
          fontWeight: "normal",
          color: "#D8D8D8",
          margin: 10,
        },
        splitLine: {
          show: false,
        },
        axisTick: {
          show: false,
          alignWithLabel: true,
        },
        boundaryGap: true,
        data: [
          "机柜",
          "路由器", "服务器", "交换机", "UPS", "空调",
        ],
      },
    ],

    yAxis: [
      {
        type: "value",
        name: "单位: %",
        max: 100,
        nameGap: 15,
        nameTextStyle: {
          fontSize: 14,
          fontFamily: "SourceHanSansCN-Normal",
          fontWeight: 400,
          color: "#D8D8D8",
        },
        splitLine: {
          show: true,
          lineStyle: {
            color: "#3D5266",
            type: "dashed",
          },
        },
        axisLine: {
          show: false,
          lineStyle: {
            color: "#B3DFFF",
          },
        },
        axisLabel: {
          show: true,
          fontSize: 14,
          fontFamily: "SourceHanSansCN-Regular",
          fontWeight: "normal",
          color: "#D8D8D8",
          margin: 10,
        },
        axisTick: {
          show: false,
        },
      },
    ],
    series: [
      {
        name: "UPS负载率",
        stack: "total",
        data: [80, 40, 90, 60, 85, 10],
        type: "bar",
        barWidth: 14,
        label: {
          show: false,
        },
        itemStyle: {
          color: function (params) {
            //首先定义一个数组
            var v1 = {
              type: "linear",
              x: 0,
              y: 0,
              x2: 0,
              y2: 1,
              colorStops: [
                {
                  offset: 0,
                  color: "rgba(21,154,255,1)", // 0% 处的颜色
                },
                {
                  offset: 1,
                  color: "rgba(21,154,255,0)", // 100% 处的颜色
                },
              ],
              global: false, // 缺省为 false
            }

            var v2 = {
              type: "linear",
              x: 0,
              y: 0,
              x2: 0,
              y2: 1,
              colorStops: [
                {
                  offset: 0,
                  color: "rgba(247, 181, 0, 1)", // 0% 处的颜色
                },
                {
                  offset: 1,
                  color: "rgba(247, 181, 0, 0)", // 100% 处的颜色
                },
              ],
              global: false, // 缺省为 false
            }
            if (params.dataIndex % 2 == 0) {
              return v1
            } else {
              return v2
            }
          },
          borderWidth: 1,
          barBorderRadius: [15, 15, 0, 0],
        },
      },

    ],
  })
}
setTimeout(upOpt, 0)


