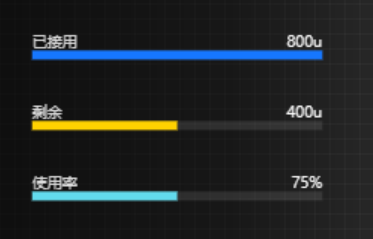
柱状图-横向柱状图-不同颜色
效果图:

代码:
//获取echart实例
const chart = this.refs.vChartRef.chart
const data = [{
  value: 800,
  name: '已接用'
},
{
  value: 400,
  name: '剩余'
},
{
  value: 400,
  name: '使用率'
}]
let total = data.reduce((p, v) => {
  return p + v.value - 7
}, 0)
const update = () => {
  // 图表设置tooltip
  chart.setOption({
    backgroundColor: "transparent",
    legend: {
      show: false
    },
    xAxis: {
      show: false,
    },
    grid: {
      left: '5%',
      top: '8%',
      width: '90%',
      height: '94%',
    },
    yAxis: [
      {
        triggerEvent: true,
        show: true,
        inverse: true,
        data: ['已接用', '剩余', '使用率'],
        axisLine: {
          show: false,
        },
        splitLine: {
          show: false,
        },
        axisTick: {
          show: false,
        },
        axisLabel: {
          interval: 0,
          inside: true,
          color: 'rgba(255, 255, 255, 0.85)',
          margin: 0,
          padding: [0, 0, 14, 0],
          align: 'left',
          verticalAlign: 'bottom',
          formatter: function (value, index) {
            return '{title|' + value + '}';
          },
          rich: {
            title: {
              width: 50,
              fontSize: 10,
              color: "rgba(255, 255, 255, 0.85)"
            },
          },
        },
      },
      {
        triggerEvent: true,
        show: true,
        inverse: true,
        data: ['800', '400', '800'],
        axisLine: {
          show: false,
        },
        splitLine: {
          show: false,
        },
        axisTick: {
          show: false,
        },
        axisLabel: {
          interval: 0,
          inside: true,
          color: 'rgba(255, 255, 255, 0.85)',
          margin: 0,
          padding: [0, 0, 14, 0],
          align: 'right',
          verticalAlign: 'bottom',
          formatter: function (value, index) {
            if (index == 0 || index == 1) {
              return '{title|' + value + 'u}';

            } else {
              return '{title|' + (100 - ((data[index].value / total) * 100).toFixed(0)) + '%}';
            }
          },
          rich: {
            title: {
              fontSize: 10,
              color: "rgba(255, 255, 255, 1)"
            }
          },
        },
      },
    ],
    series: [
      {
        type: 'bar',
        showBackground: true,
        barMinWidth: 6,
        backgroundStyle: {
          color: 'rgba(255, 255, 255, 0.1)',
        },
        yAxisIndex: 0,
        data: data,
        barWidth: 6,
        // align: left,
        itemStyle: {
          normal: {
            color: function (params) {
              // 给出颜色组
              var colorList = ['#1677FF', '#FFD200', '#62DBED'];
              return colorList[params.dataIndex]
            }
          },
        },
        label: {
          show: false,
        },
      },
    ],

  })
}
setTimeout(update, 0)


【推荐】国内首个AI IDE,深度理解中文开发场景,立即下载体验Trae
【推荐】编程新体验,更懂你的AI,立即体验豆包MarsCode编程助手
【推荐】抖音旗下AI助手豆包,你的智能百科全书,全免费不限次数
【推荐】轻量又高性能的 SSH 工具 IShell:AI 加持,快人一步
· 震惊!C++程序真的从main开始吗?99%的程序员都答错了
· 单元测试从入门到精通
· 【硬核科普】Trae如何「偷看」你的代码?零基础破解AI编程运行原理
· 上周热点回顾(3.3-3.9)
· winform 绘制太阳,地球,月球 运作规律