
环形图-展示label引导线
效果图:
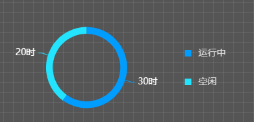
代码:
const chart = this.refs.vChartRef.chart
function upOpt() {
  chart.setOption({
    color: ['#009DFF', '#22E4FF'],
    legend: {
      show: true,
      top: "center",
      right: "7%",
      orient: "vertical",
      itemGap: 30,
      icon: "rect",
      itemWidth: 10,
      itemHeight: 10,
      textStyle: {
        fontSize: 14,
        fontFamily: "Source Han Sans CN",
        fontWeight: "normal",
        color: "#FFFFFF",
        opacity: 0.8,
        padding: [0, 0, 0, 6],
      },
    },
    toolTip: {
      show: false,
    },
    series: [{
      name: '对比',
      type: 'pie',
      radius: ['50%', '60%'],
      center: ['35%', '50%'],
      hoverAnimation: true,
      hoverOffset: 4,
      label: {
        show: true,
        fontSize: 14,
        color: '#ffffff',
        formatter: '{c}时'
      },
      labelLine: {
        show:true,
        length: 10,
        length2: 5,
      },
      data: [{
        name: '运行中',
        value: 30
      },
      {
        name: '空闲',
        value: 20
      },


      ],
    }]
  })
}
setTimeout(upOpt, 0)

 浙公网安备 33010602011771号