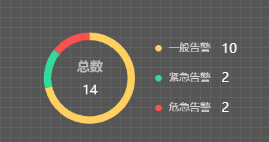
环形图-title-右侧显示圆状lenged
效果图:

代码:
const chart = this.refs.vChartRef.chart
function upOpt() {
  chart.setOption({
    color: ['#FFCF5F', '#34DA99','#FA5151'],
    title: {
      text: '总数',
      subtext: '14',
      top: '35%',
      left: '34%',
      textAlign:'center',
      textStyle: {
        fontSize: 20,
        color: '#BBBBBB',
        fontFamily: "Source Han Sans CN",
        lineHeight: 26,
        opacity: 1
      },
      subtextStyle: {
        fontSize: 20,
        color: '#FFFFFF',
        fontFamily: "Source Han Sans CN",
        lineHeight: 26,
      }
    },
    tooltip: {
      trigger: 'item',
      show: true,
      backgroundColor: 'rgba(10, 30, 30, 0.8)',
      borderColor: 'transparent',
      padding: [8, 20, 8, 8],
      textStyle: {
        color: '#fff',
        opacity: 1,
        fontSize: 15,
      },
      axisPointer: {
        type: 'none'
      }
    },
    legend: {
      show: true,
      top: "center",
      right: "20%",
      orient: "vertical",
      itemGap: 30,
      icon: "circle",
      itemWidth: 10,
      itemHeight: 10,
      textStyle: {
        fontSize: 16,
        fontFamily: "Source Han Sans CN",
        fontWeight: "normal",
        color: "#FFFFFF",
        opacity: 0.8,
        padding: [0, 0, 0, 6],
      },
    },
    series: [{
      name: '',
      type: 'pie',
      radius: ['51%', '61%'],
      center: ['35%', '50%'],
      hoverAnimation: true,
      hoverOffset: 4,
      label: {
        show: false,
      },
      data: [{
        name: '一般告警',
        value: 10
      },
      {
        name: '紧急告警',
        value: 2
      },
      {
        name: '危急告警',
        value: 2
      }
      ],
    }]
  })
}
setTimeout(upOpt, 0)


