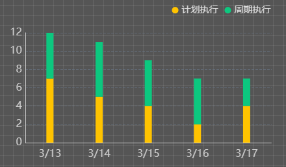
柱状图-竖状堆叠柱状图
效果图:

代码:
const chart = this.refs.vChartRef.chart
function upOpt() {
  chart.setOption({
    tooltip: {
      trigger: 'axis',
      show: true,
      backgroundColor: 'rgba(10, 30, 30, 0.8)',
      borderColor: 'transparent',
      padding: [8, 20, 8, 8],
      textStyle: {
        color: '#fff',
        opacity: 1,
        fontSize: 15,
      },
      axisPointer: {
        type: 'line'
      }
    },
    grid: {
      left: '8%',
      top: '20%',
      width: '89%',
      height: '65%',
    },
    legend: {
      show: true,
      top: "2%",
      right: "2%",
      itemGap: 10,
      icon: "circle",
      itemWidth: 10,
      itemHeight: 10,
      textStyle: {
        fontSize: 14,
        fontFamily: "Source Han Sans CN",
        fontWeight: "normal",
        color: "#FFFFFF",
        opacity: 0.8,
      },
    },
    xAxis: {
      type: 'category',
      data: ["3/13", "3/14", "3/15", "3/16", "3/17"],
      boundaryGap: true,
      splitLine: {
        lineStyle: {
          type: 'solid',
        },
        alignWithLabel: true,
      },
      axisLine: {
        lineStyle: {
          type: 'solid',
          color: '#CCCCCC'
        },
      },
      axisTick: {
        show: false
      },
      axisLabel: {
        fontSize: 16,
        fontFamily: 'Source Han Sans CN',
        fontWeight: 400,
        lineHeight: 30,
        color: '#cccccc',
        margin: 3
      },
    },
    yAxis: {
      type: 'value',
      splitLine: {
        lineStyle: {
          type: 'dashed',
          color: 'rgba(105, 119, 135, 0.6)'
        }
      },
      axisLine: {
        show: true,
        lineStyle: {
          type: 'solid',
          color: '#CCCCCC'
        },

      },
      axisTick: {
        show: false
      },
      axisLabel: {
        fontSize: 16,
        fontFamily: 'Source Han Sans CN',
        fontWeight: 400,
        color: '#cccccc',
        margin: 5
      },
    },
    series: [{
      name: "计划执行",
      type: 'bar',
      animationDuration: 1000,
      animationEasing: "cubicInOut",
      barWidth: 11,
      data: [7, 5, 4, 2, 4],
      itemStyle: {
        color: "#FFC300"
      },
      stack: "堆叠"
    },
    {
      name: "周期执行",
      type: 'bar',
      barGap: '10%',
      animationDuration: 1000,
      animationEasing: "cubicInOut",
      barWidth: 11,
      data: [5, 6, 5, 5,3],
      itemStyle: {
        color: "#0CC87F"
      },
      stack: "堆叠"
    }
    ]
  })
}
setTimeout(upOpt, 0)


【推荐】国内首个AI IDE,深度理解中文开发场景,立即下载体验Trae
【推荐】编程新体验,更懂你的AI,立即体验豆包MarsCode编程助手
【推荐】抖音旗下AI助手豆包,你的智能百科全书,全免费不限次数
【推荐】轻量又高性能的 SSH 工具 IShell:AI 加持,快人一步
· 震惊!C++程序真的从main开始吗?99%的程序员都答错了
· 单元测试从入门到精通
· 【硬核科普】Trae如何「偷看」你的代码?零基础破解AI编程运行原理
· 上周热点回顾(3.3-3.9)
· winform 绘制太阳,地球,月球 运作规律