
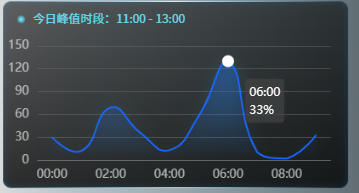
折线图 最大值显示白点,默认显示tooltip框框,自定义tooltip
效果图:
代码如下:(直接放整个vue文件了,省事)
<template>
  <div>
    <div style="width: 406px; height:220px" id="zz_r_two1"></div>
    <div class="xsTitle">
      <div class="fang"></div>
      <span>今日峰值时段:11:00 - 13:00</span>
    </div>
  </div>
</template>

<script>
export default {
  name: "zz_r_two1",
  mounted() {
    this.drawLine();
  },
  methods: {
    // 自适应字体大小变化
    WidthAdaptive(res) {
      var windth = window.innerWidth;
      let fontSize = windth / 1920;
      return fontSize * res;
    },
    drawLine() {
      // 基于准备好的dom,初始化echarts实例
      let myChart = this.$echarts.init(document.getElementById("zz_r_two1"));
      let xLabel = [
        "00:00",
        "01:00",
        "02:00",
        "03:00",
        "04:00",
        "05:00",
        "06:00",
        "07:00",
        "08:00",
        "09:00",
      ];
      let goOutSchool = [30, 12, 69, 36, 13, 58, 130, 10, 2, 33];
      let maxNum = this.getMax(goOutSchool);
      let allNum = this.getAll(goOutSchool);
      let maxIndex = this.getMaxIndex(goOutSchool);
      let getSD = xLabel[maxIndex];

      let percentage = this.getPercentage(allNum, maxNum);

      let option = {
        backgroundColor: "transparent",
        grid: {
          top: "24%",
          left: "10%",
          right: "5%",
          bottom: "15%",
          // containLabel: true
        },
        tooltip: {
          show: true,
          backgroundColor: "rgba(67, 67, 67, 0.7)",
          formatter: "{b0}<br />" + percentage,
        },
        xAxis: [
          {
            type: "category",
            boundaryGap: true,
            axisLine: {
              //坐标轴轴线相关设置。数学上的x轴
              show: true,
              lineStyle: {
                color: "rgba(255, 255, 255, 0.15)",
              },
            },
            axisLabel: {
              //坐标轴刻度标签的相关设置
              textStyle: {
                color: "rgba(255, 255, 255, 0.65)",
                fontSize: this.WidthAdaptive(14),
                padding: this.WidthAdaptive(2),
              },
              formatter: function(data) {
                return data;
              },
            },
            splitLine: {
              show: false,
              lineStyle: {
                color: "#192a44",
              },
            },
            axisTick: {
              show: false,
            },
            data: xLabel,
          },
        ],
        yAxis: [
          {
            splitLine: {
              lineStyle: {
                type: "solid",
                color: "rgba(112,112,112,0.5)",
              },
            },
            axisLine: {
              show: false,
              lineStyle: {
                color: "#8C9493",
              },
            },
            axisLabel: {
              show: true,
              textStyle: {
                color: "rgba(255, 255, 255, 0.65)",
                fontSize: this.WidthAdaptive(14),
                padding: this.WidthAdaptive(2),
              },
            },
            axisTick: {
              show: false,
            },
          },
        ],
        series: [
          {
            name: "峰值时段",
            type: "line",
            symbol: "circle", // 默认是空心圆(中间是白色的),改成实心圆
            showAllSymbol: true,
            symbolSize: 0,
            smooth: true,
            lineStyle: {
              normal: {
                width: this.WidthAdaptive(2),
                color: "rgba(25, 104, 255, 1)", // 线条颜色
              },
              borderColor: "rgba(0,0,0,.4)",
            },
            itemStyle: {
              color: "rgba(25, 104, 255, 1)",
              borderColor: "#646ace",
              borderWidth: this.WidthAdaptive(20),
            },
            tooltip: {
              show: true,
            },
            markPoint: {
              data: [
                {
                  type: "max",
                  name: getSD,
                  symbol: "circle",
                  symbolSize: this.WidthAdaptive(14),
                  itemStyle: {
                    color: "rgba(255,255,255,1)",
                    borderColor: "#fff",
                    borderWidth: this.WidthAdaptive(0),
                  },
                  label: { show: false, fontSize: 0 },
                },
              ],
            },
            areaStyle: {
              //区域填充样式
              normal: {
                //线性渐变,前4个参数分别是x0,y0,x2,y2(范围0~1);相当于图形包围盒中的百分比。如果最后一个参数是‘true’,则该四个值是绝对像素位置。
                color: new this.$echarts.graphic.LinearGradient(
                  0,
                  0,
                  0,
                  1,
                  [
                    {
                      offset: 0,
                      color: "rgba(25, 104, 255, .5)",
                    },
                    {
                      offset: 1,
                      color: "rgba(25, 104, 255, 0)",
                    },
                  ],
                  false
                ),
                shadowColor: "rgba(61, 230, 255, 0.5)", //阴影颜色
                shadowBlur: this.WidthAdaptive(20), //shadowBlur设图形阴影的模糊大小。配合shadowColor,shadowOffsetX/Y, 设置图形的阴影效果。
              },
            },
            data: goOutSchool,
          },
        ],
      };
      window.onresize = function() {
        myChart.resize();
      };
      myChart.setOption(option);

      myChart.dispatchAction({
        type: "showTip",
        seriesIndex: 0, // 显示第几个series
        dataIndex: maxIndex, // 显示第几个数据
      });
    },

    //获取最大值
    getMax(arr) {
      //假设最大值max 为arr[0]
      var max = arr[0];
      //遍历对比
      for (var i = 0; i < arr.length; i++) {
        //若max小于当前项 说明不是最大值 将当前项的值赋予max
        // 继续遍历对比找到最大的值
        if (max < arr[i]) {
          max = arr[i];
        }
      }
      return max;
    },
    // 获得总数
    getAll(arr) {
      let num = 0;
      for (let i = 0; i < arr.length; i++) {
        num += parseInt(arr[i]);
      }
      return num;
    },
    // 计算最大值所占百分比
    getPercentage(all, max) {
      return (max / all).toFixed(2) * 100 + "%";
    },
    // 获得最大值下标
    getMaxIndex(arr) {
      var max = arr[0];
      //声明了个变量 保存下标值
      var index = 0;
      for (var i = 0; i < arr.length; i++) {
        if (max < arr[i]) {
          max = arr[i];
          index = i;
        }
      }
      return index;
    },
  },
};
</script>

<style scoped>
.xsTitle {
  width: 100%;
  height: 20px;
  position: absolute;
  left: 0;
  top: 12px;
  z-index: 999;
  display: flex;
  align-items: center;
}
.xsTitle > .fang {
  width: 9px;
  height: 9px;
  margin-left: 17px;
  margin-right: 9px;
  background: url("../img/f1.png") no-repeat;
  background-size: 100% 100%;
}
.xsTitle > span {
  font-family: Source Han Sans CN;
  font-size: 14px;
  font-weight: normal;
  color: #63dbee;
}
</style>

