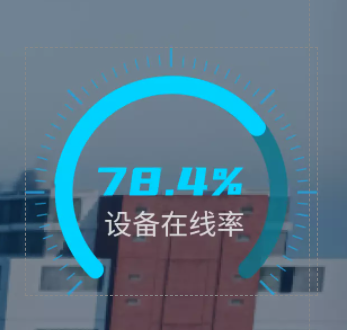
大半园仪表盘

<template>
  <div id="yibiao" style="width: 100%; height: 100%"></div>
</template>

<script>
export default {
  name: "yibiao",
  data() {
    return {
      datas: 0,
    };
  },
  props: ["data"],
  mounted() {
    this.myecharts();
    this.WidthAdaptive();
  },
  watch: {
    data(n, o) {
      this.datas = n;
      this.myecharts();
    },
  },
  methods: {
    WidthAdaptive(res) {
      var windth = window.screen.width;
      let fontSize = windth / 7296;
      return fontSize * res;
    },
    myecharts() {
      let myChart = this.$echarts.init(document.getElementById("yibiao"));

      let score = 270 * this.datas;
      let maxScore = 270,
        scoresPercentage = ((score / maxScore) * 100).toFixed(2);

      var option = {
        title: [
          {
            text: "设备在线率",
            x: "center",
            top: "53%",
            textStyle: {
              color: "#cccccc",
              fontSize: this.WidthAdaptive(40),
              fontWeight: "100",
            },
          },
          {
            text: scoresPercentage + "%",
            x: "center",
            top: "40%",
            textStyle: {
              fontSize: this.WidthAdaptive(60),
              fontFamily: "YouSheBiaoTiHei",
              color: "rgba(0, 211, 255, 1)",
              foontWeight: "Regular",
            },
          },
        ],
        series: [
          {
            type: "gauge",
            startAngle: 225,
            radius: "60%",
            center: ["50%", "50%"],
            splitNumber: 26,
            detail: {
              offsetCenter: [0, 0],
              formatter: " ",
            },
            pointer: {
              show: false,
            },
            axisLine: {
              show: true,
              lineStyle: {
                color: [[1, "rgba(4, 118, 142, 0.5)"]],
                width: 32,
              },
            },
            axisTick: {
              show: false,
            },
            splitLine: {
              show: false,
            },
            axisLabel: {
              show: false,
            },
          },
          // 仪表盘值得渐变
          {
            type: "pie",
            zlevel: 10,
            radius: ["50%", "60%"],
            center: ["50%", "50%"],
            silent: true,
            animationDuration: 1500,
            animationEasing: "cubicInOut",
            startAngle: 225,
            label: {
              show: false,
            },
            labelLine: {
              show: false,
            },
            data: [
              {
                name: "",
                value: scoresPercentage,
                itemStyle: {
                  color: "rgba(0, 211, 255, 1)",
                },
              },
              {
                value: 133 - scoresPercentage,
                itemStyle: {
                  opacity: 0,
                  color: "rgba(4, 118, 142, 0.5)",
                },
              },
            ],
          },
          {
            name: "外部刻度",
            type: "gauge",
            center: ["50%", "50%"],
            radius: "65%",
            min: 0, //最小刻度
            max: 100, //最大刻度
            splitNumber: 10, //刻度数量
            startAngle: 225,
            endAngle: -45,
            axisLine: {
              show: true,
              lineStyle: {
                width: 1,
                color: [[1, "rgba(0,0,0,0)"]],
              },
            }, //仪表盘轴线
            axisLabel: {
              show: false,
            }, //刻度标签。
            axisTick: {
              show: true,
              splitNumber: 7,
              lineStyle: {
                color: "rgba(32, 166, 228, 1)", //用颜色渐变函数不起作用
                width: 1,
              },
              length: -8,
            }, //刻度样式
            splitLine: {
              show: true,
              length: -20,
              lineStyle: {
                color: "rgba(32, 166, 228, 1)", //用颜色渐变函数不起作用
              },
            }, //分隔线样式
            detail: {
              show: false,
            },
            pointer: {
              show: false,
            },
          },
        ],
      };

      myChart.setOption(option);

      window.onresize = myChart.resize;
    },
  },
};
</script>

<style>
</style>
<template>
<div id="lightset" style="width: 100%; height: 100%"></div>
</template>
<script>
export default {
name: "lightset",
data() {
return {
lightRates: 0,
};
},
props: ["lightRate"],
mounted() {
this.myecharts();
this.WidthAdaptive();
},
watch: {
lightRate(n, o) {
this.lightRates = n;
this.myecharts();
},
},
methods: {
WidthAdaptive(res) {
var windth = window.screen.width;
let fontSize = windth / 2469;
return fontSize * res;
},
myecharts() {
let myChart = this.$echarts.init(document.getElementById("lightset"));
let score = 180 * this.lightRates,
maxScore = 180,
scoresPercentage = score / maxScore;
let value = scoresPercentage * 100;
let title = "故障设备(台) 400";
let int = value.toFixed(2).split(".")[0];
let float = value.toFixed(2).split(".")[1];
var option = {
title: {
text: "{a|" + int + "}{a|." + float + "%}" + "\n" + "{b|亮灯率}",
x: "center",
y: "50%",
textStyle: {
rich: {
a: {
fontSize: this.WidthAdaptive(24),
color: "rgba(255, 255, 255, 1)",
fontFamily: "YouSheBiaoTiHei",
padding: [this.WidthAdaptive(5), 0, 0, 0],
},
b: {
fontSize: this.WidthAdaptive(14),
color: "#CECECE",
},
c: {
fontSize: this.WidthAdaptive(12),
color: "#CCCCCC",
padding: [this.WidthAdaptive(-55), 0, 0, 0],
},
},
},
},
graphic: {
elements: [
{
type: "image",
z: 4,
style: {
image: require("@/assets/image/yibiao4.png"),
width: this.WidthAdaptive(100),
height: this.WidthAdaptive(45),
},
left: "center",
top: "24%",
silent: true,
},
],
},
series: [
{
type: "gauge",
startAngle: 180,
endAngle: 0,
radius: "90%",
center: ["50%", "55%"],
splitNumber: 26,
detail: {
offsetCenter: [0, 0],
formatter: " ",
},
pointer: {
show: false,
},
axisLine: {
show: true,
lineStyle: {
color: [
[0, "rgba(255, 160, 0, 0.2)"],
[1, "rgba(255, 160, 0, 0.2)"],
],
width: this.WidthAdaptive(12),
},
},
axisTick: {
show: false,
},
splitLine: {
show: false,
},
axisLabel: {
show: false,
},
},
// 仪表盘值得渐变
{
type: "pie",
zlevel: 10,
radius: ["80%", "90%"],
center: ["50%", "55%"],
silent: true,
startAngle: 180,
endAngle: 0,
label: {
show: false,
},
labelLine: {
show: false,
},
data: [
{
name: "",
value: scoresPercentage,
itemStyle: {
color: {
type: "linear",
x: 0,
y: 0,
x2: 0,
y2: 1,
colorStops: [
{
offset: 0,
color: "rgba(255, 160, 0, 0.5)", // 0% 处的颜色
},
{
offset: 1,
color: "rgba(255, 160, 0, 1)", // 100% 处的颜色
},
],
global: false, // 缺省为 false
},
},
},
{
value: 2 - scoresPercentage,
itemStyle: {
opacity: 0,
color: "rgba(255, 255, 255, 0)",
},
},
],
animationDuration: 1500,
animationEasing: "cubicInOut",
},
],
};
myChart.setOption(option);
window.onresize = myChart.resize;
},
},
};
</script>
<style>
</style>


