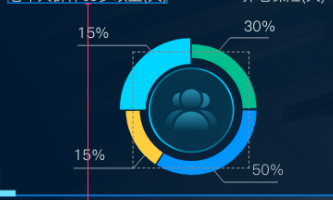
<template>
	<div id="xxxx" style="width: 100%; height: 100%;"></div>
</template>

<script>
	export default {
		data() {
			return {

			}
		},
		mounted() {
			this.myecharts();
			this.WidthAdaptive();
		},
		watch: {

		},
		methods: {
			WidthAdaptive(res) {
				var windth = window.screen.width;
				let fontSize = windth / 4422;
				return fontSize * res;
			},
			myecharts() {
				let myChart = this.$echarts.init(document.getElementById('xxxx'));

				// 数据
				const dataArray = [{
						name: '汉族',
						value: 50
					},
					{
						name: '回族',
						value: 30
					},
					{
						name: '满族',
						value: 10
					},
					{
						name: '其他',
						value: 10
					}
				]

				// 计算总数
				let total = dataArray.reduce((p, v) => {
					return p + v.value
				}, 0)

				// 颜色
				const color = ['#00D5FF', '#00BF8F', '#0095FF', '#FFCF40']

				// tooltip
				let tooltip = {
					trigger: 'item',
					show: true,
					backgroundColor: 'rgba(2, 26, 47, 0.62)',
					borderColor: 'transparent',
					padding: [8, 20, 8, 8],
					textStyle: {
						color: '#fff',
						opacity: 1,
						fontSize: this.WidthAdaptive(16),
					},
					axisPointer: {
						type: 'line'
					}
				}

				// graphic
				// const graphic = {
				// 	elements: [{
				// 		type: "image",
				// 		style: {
				// 			image: require("../../img/bg.png"),
				// 			width: this.WidthAdaptive(343),
				// 			height: this.WidthAdaptive(343),
				// 		},
				// 		left: 'center',
				// 		top: 'center',
				// 		silent: true,
				// 	}]
				// }

				// series
				const series = [{
					type: 'pie',
					radius: ['40%', '55%'],
					center: ['50%', '50%'],
					hoverAnimation: true,
					hoverOffset: this.WidthAdaptive(10),
					color: color,
					itemStyle: {
						borderColor: "rgba(2, 26, 47, 0.62)",
						borderWidth: this.WidthAdaptive(5)
					},
					label: {
						show: true,
						padding: [this.WidthAdaptive(-30), this.WidthAdaptive(-50), 0, this.WidthAdaptive(-50)],
						fontSize: this.WidthAdaptive(16),
						color: '#ffffff',
						formatter: '{d}%'
					},
					labelLine: {
						normal: {
							length: this.WidthAdaptive(20),
							length2: this.WidthAdaptive(90),
							lineStyle: {
								color: '#ffffff',
								opacity: 0.6
							}
						}
					},
					data: dataArray
				}]

				// 渲染
				var option = {
					tooltip,
					series,
					color,
					// graphic
				}
				myChart.setOption(option);
				window.onresize = myChart.resize;

				//获取最大值下标
				var ds = option.series[0].data;
				var max = ds[0];
				var indexs = 0;
				for (var i = 0; i < ds.length; i++) {
					if (max < ds[i]) {
						max = ds[i];
						indexs = i;
					}
				}

				//默认选中最大值
				myChart.dispatchAction({
					type: 'highlight',
					seriesIndex: 0, // 显示第几个series
					dataIndex: indexs // 显示第几个数据
				});


				let index = 0;
				myChart.on("mouseover", function(e) {
					if (e.dataIndex != index) {
						myChart.dispatchAction({
							type: "downplay",
							seriesIndex: 0,
							dataIndex: index
						});
					}
				});
				myChart.on("mouseout", function(e) {
					index = e.dataIndex;
					myChart.dispatchAction({
						type: "highlight",
						seriesIndex: 0,
						dataIndex: e.dataIndex
					});
				});
			}
		},
	}
</script>

<style scoped>
</style>


