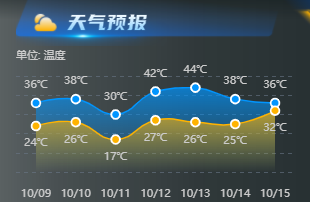
echarts-折线图-实心拐点白色外边
先看效果图:

<div id="weatherForecast" style="width:100%;height:100%"></div>
//自适应字体大小变化
WidthAdaptive(res) {
      var windth = window.innerWidth;
      let fontSize = windth / 5280;
      return fontSize * res;
    },
myecharts() {
      let myChart = this.$echarts.init(
        document.getElementById("weatherForecast")
      );

      var option = {
        grid: {
          left: 0,
          top: this.WidthAdaptive(80),
          width: "100%",
          height: "60%",
        },
        xAxis: {
          type: "category",
          data: ["10/09", "10/10", "10/11", "10/12", "10/13", "10/14", "10/15"],
          boundaryGap: true,
          splitLine: {
            //show: true,
            lineStyle: {
              type: "solid",
            },
            alignWithLabel: true,
          },
          axisLine: {
            show: false,
          },
          axisTick: {
            show: false,
          },
          axisLabel: {
            fontSize: this.WidthAdaptive(30),
            fontFamily: "Source Han Sans CN",
            fontWeight: 400,
            lineHeight: this.WidthAdaptive(40),
            color: "#cccccc",
            margin: this.WidthAdaptive(40),
          },
        },
        yAxis: {
          name: "单位: 温度",
          type: "value",
          splitLine: {
            lineStyle: {
              type: "dashed",
              color: "rgba(105, 119, 135, 0.6)",
            },
          },
          axisLine: {
            show: false,
          },
          axisTick: {
            show: false,
          },
          axisLabel: {
            show: false,
          },
          nameGap: this.WidthAdaptive(30),
          nameTextStyle: {
            align: "left",
            fontSize: this.WidthAdaptive(30),
            fontFamily: "Source Han Sans CN",
            fontWeight: 400,
            lineHeight: this.WidthAdaptive(50),
            color: "#cccccc",
          },
        },
        series: [
          {
            data: [36, 38, 30, 42, 44, 38, 36],
            type: "line",
            areaStyle: {
              color: {
                type: "linear",
                x: 0,
                y: 0,
                x2: 0,
                y2: 1,
                colorStops: [
                  {
                    offset: 0,
                    color: "#0095FF", // 0% 处的颜色
                  },
                  {
                    offset: 1,
                    color: "rgba(0, 149, 255, 0)", // 100% 处的颜色
                  },
                ],
                global: false, // 缺省为 false
              },
            },
            lineStyle: {
              color: "#0095FF",
              width: this.WidthAdaptive(4),
            },
            symbol: "circle",
            symbolSize: this.WidthAdaptive(24),
            itemStyle: {
              color: "#0095FF",
              borderColor: "#ffffff",
              borderType: "solid",
              borderWidth: this.WidthAdaptive(5),
            },
            emphasis: {
              scale: false,
              lineStyle: {
                width: this.WidthAdaptive(6),
              },
            },
            smooth: true,
            label: {
              show: true,
              position: "top",
              formatter: "{c}℃",
              fontSize: this.WidthAdaptive(30),
              fontFamily: "Source Han Sans CN",
              fontWeight: 400,
              lineHeight: this.WidthAdaptive(40),
              color: "#cccccc",
            },
          },
          {
            data: [24, 26, 17, 27, 26, 25, 32],
            type: "line",
            areaStyle: {
              color: {
                type: "linear",
                x: 0,
                y: 0,
                x2: 0,
                y2: 1,
                colorStops: [
                  {
                    offset: 0,
                    color: "#FFB300", // 0% 处的颜色
                  },
                  {
                    offset: 1,
                    color: "rgba(255,179,0, 0)", // 100% 处的颜色
                  },
                ],
                global: false, // 缺省为 false
              },
            },
            lineStyle: {
              color: "#FFB300",
              width: this.WidthAdaptive(4),
            },
            symbol: "circle",
            symbolSize: this.WidthAdaptive(24),
            itemStyle: {
              color: "#FFB300",
              borderColor: "#ffffff",
              borderType: "solid",
              borderWidth: this.WidthAdaptive(5),
            },
            emphasis: {
              scale: false,
              lineStyle: {
                width: this.WidthAdaptive(6),
              },
            },
            smooth: true,
            label: {
              show: true,
              position: "bottom",
              formatter: "{c}℃",
              fontSize: this.WidthAdaptive(30),
              fontFamily: "Source Han Sans CN",
              fontWeight: 400,
              lineHeight: this.WidthAdaptive(40),
              color: "#cccccc",
            },
          },
        ],
      };
      myChart.setOption(option);

      window.onresize = myChart.resize;
    },


