
echarts-折线图-渐变阴影
效果图:
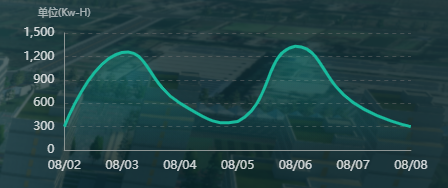
<div style="width: 462px; height: 180px" id="indexLeftbottom"></div>
// 自适应字体大小变化
    WidthAdaptive(res) {
      var windth = window.innerWidth;
      let fontSize = windth / 1920;
      return fontSize * res;
    },
    drawLine() {
      // 基于准备好的dom,初始化echarts实例
      let myChart = this.$echarts.init(
        document.getElementById("indexLeftbottom")
      );
      let xLabel = [
        "08/02",
        "08/03",
        "08/04",
        "08/05",
        "08/06",
        "08/07",
        "08/08",
      ];
      let goOutSchool = ["300", "1250", "602", "365", "1330", "610", "300"];

      let option = {
        backgroundColor: "transparent",
        grid: {
          top: "15%",
          left: "15%",
          right: "10%",
          bottom: "20%",
          // containLabel: true
        },
        xAxis: [
          {
            type: "category",
            boundaryGap: false,
            axisLine: {
              //坐标轴轴线相关设置。数学上的x轴
              show: true,
              lineStyle: {
                color: "#8C9493",
              },
            },
            axisLabel: {
              //坐标轴刻度标签的相关设置
              textStyle: {
                color: "rgba(255, 255, 255, 0.8)",
                padding: this.WidthAdaptive(2),
              },
              formatter: function (data) {
                return data;
              },
            },
            splitLine: {
              show: false,
              lineStyle: {
                color: "#192a44",
              },
            },
            axisTick: {
              show: false,
            },
            data: xLabel,
          },
        ],
        yAxis: [
          {
            name: "单位(Kw-H)",
            nameTextStyle: {
              color: " rgba(255, 255, 255, 0.6)",
              fontSize: this.WidthAdaptive(10),
            },
            splitLine: {
              lineStyle: {
                type: "dashed",
                color: "rgba(112,112,112,0.5)",
              },
            },
            axisLine: {
              show: true,
              lineStyle: {
                color: "#8C9493",
              },
            },
            axisLabel: {
              show: true,
              textStyle: {
                color: "rgba(255, 255, 255, 0.8)",
                padding: this.WidthAdaptive(2),
              },
            },
            axisTick: {
              show: false,
            },
          },
        ],
        series: [
          {
            name: "放学",
            type: "line",
            symbol: "circle", // 默认是空心圆(中间是白色的),改成实心圆
            showAllSymbol: true,
            symbolSize: 0,
            smooth: true,
            lineStyle: {
              normal: {
                width: this.WidthAdaptive(3),
                color: "rgba(24,187,157,1)", // 线条颜色
              },
              borderColor: "rgba(0,0,0,.4)",
            },
            itemStyle: {
              color: "rgba(24,187,157,1)",
              borderColor: "#646ace",
              borderWidth: this.WidthAdaptive(20),
            },
            tooltip: {
              show: true,
            },
            areaStyle: {
              //区域填充样式
              normal: {
                //线性渐变,前4个参数分别是x0,y0,x2,y2(范围0~1);相当于图形包围盒中的百分比。如果最后一个参数是‘true’,则该四个值是绝对像素位置。
                color: new this.$echarts.graphic.LinearGradient(
                  0,
                  0,
                  0,
                  1,
                  [
                    {
                      offset: 0,
                      color: "rgba(24,187,157,.3)",
                    },
                    {
                      offset: 1,
                      color: "rgba(24,187,157, 0)",
                    },
                  ],
                  false
                ),
                shadowColor: "rgba(10,219,250, 0.5)", //阴影颜色
                shadowBlur: this.WidthAdaptive(20), //shadowBlur设图形阴影的模糊大小。配合shadowColor,shadowOffsetX/Y, 设置图形的阴影效果。
              },
            },
            data: goOutSchool,
          },
        ],
      };
      window.onresize = function () {
        myChart.resize();
      };
      myChart.setOption(option);
    },

