大数据-时间清洗+流量分析
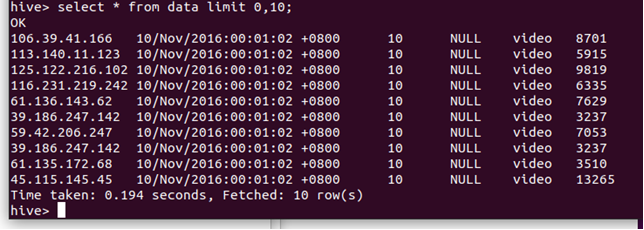
Result文件数据说明:
Ip:106.39.41.166,(城市)
Date:10/Nov/2016:00:01:02 +0800,(日期)
Day:10,(天数)
Traffic: 54 ,(流量)
Type: video,(类型:视频video或文章article)
Id: 8701(视频或者文章的id)
测试要求:
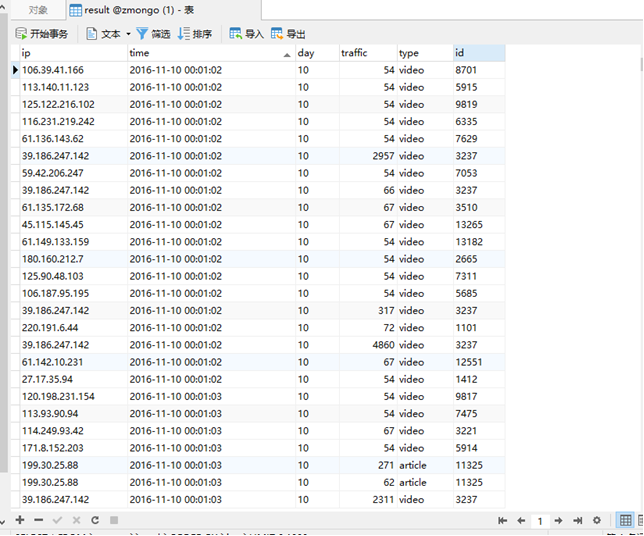
1、 数据清洗:按照进行数据清洗,并将清洗后的数据导入MongDB数据库中。
两阶段数据清洗:
(1)第一阶段:把需要的信息从原始日志中提取出来
ip: 199.30.25.88
time: 10/Nov/2016:00:01:03 +0800
traffic: 62
文章: article/11325
视频: video/3235
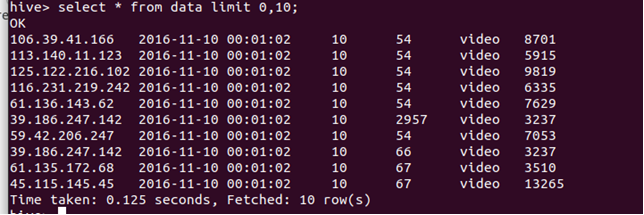
导入hive
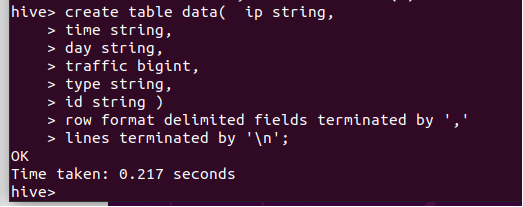
创建表:
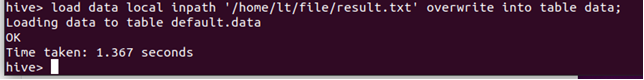
导入数据:
load data local inpath '/home/lt/file/result.txt' overwrite into table data;
(2)第二阶段:根据提取出来的信息做精细化操作
ip--->城市 city(IP)
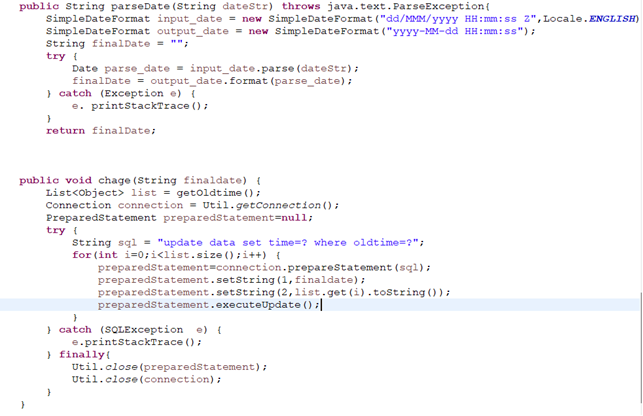
date--> time:2016-11-10 00:01:03
day: 10
traffic:62
type:article/video
id:11325
清洗时间格式
(3)MongDB数据库表结构:
create table data( ip string, time string , day string, traffic bigint,
type string, id string )
2、数据处理:
·统计最受欢迎的视频/文章的Top10访问次数 (video/article)
SELECT
count(*),
id,
type
FROM
`result`
GROUP BY
id
ORDER BY
count(*) DESC
LIMIT 0,
10
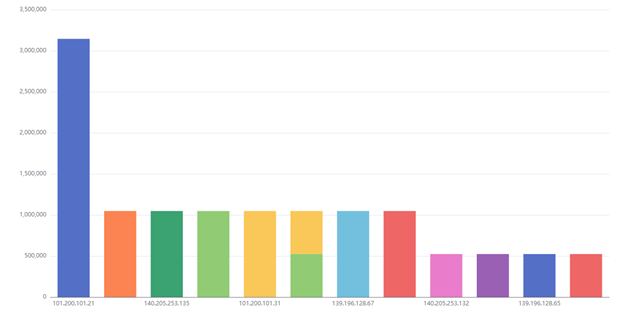
·按照地市统计最受欢迎的Top10课程 (ip)
·按照流量统计最受欢迎的Top10课程 (traffic)
SELECT
sum(traffic),
id,
type
FROM
`result`
GROUP BY
id
ORDER BY
sum(traffic) DESC
LIMIT 0,
10
2、 数据可视化:将统计结果倒入MySql数据库中,通过图形化展示的方式展现出来。
可视化展示


 浙公网安备 33010602011771号