
均匀三角滤波器的实现
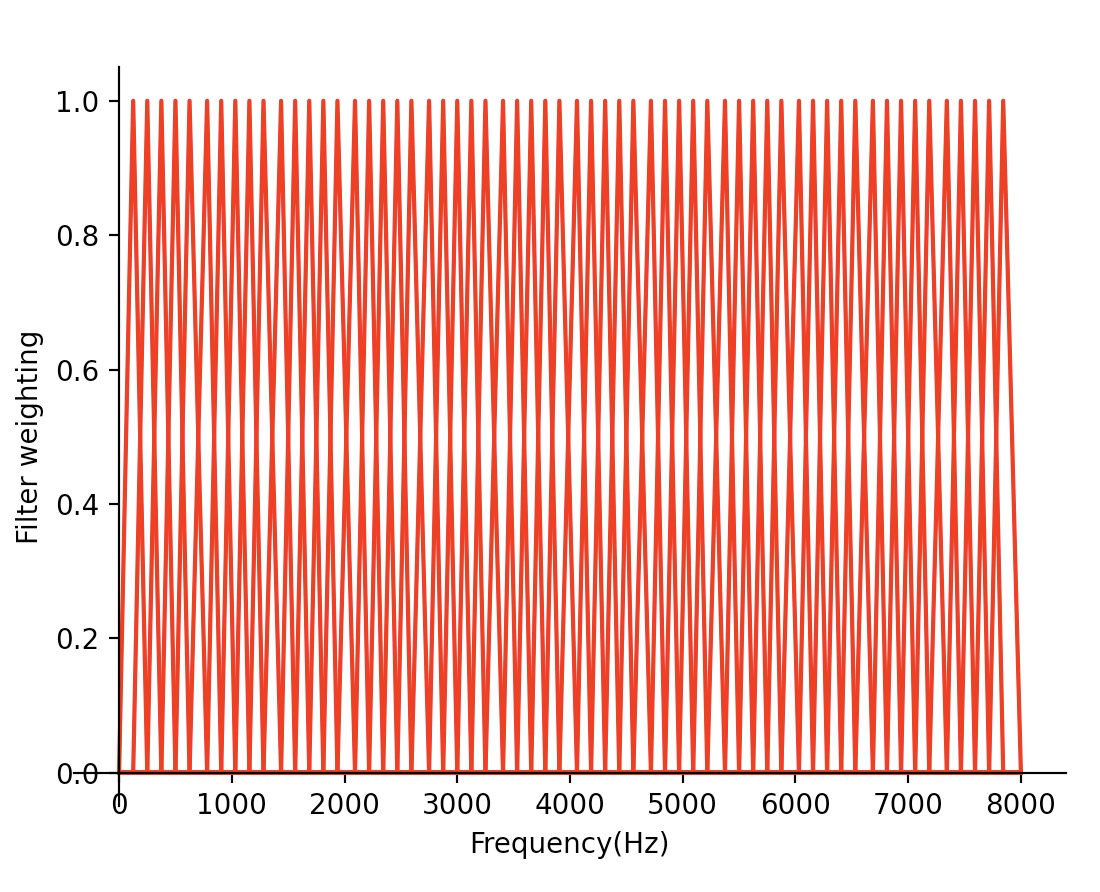
均匀三角滤波器
使用这种滤波器带,可以获得沿频率轴具有相同频率分辨率的带通能量谱。
1.创建一个均匀三角滤波器,该滤波器包含60个频段。
import numpy as np
import librosa
import librosa.display
import matplotlib.pyplot as plt


ax = plt.gca()
#去掉边框
ax.spines['top'].set_color('none')
ax.spines['right'].set_color('none')
#移位置 设为原点相交
ax.xaxis.set_ticks_position('bottom')
ax.spines['bottom'].set_position(('data',0))
ax.yaxis.set_ticks_position('left')
ax.spines['left'].set_position(('data',0))

def create_filter(fs, nfft,fl, fh, count):
    p = count      #滤波器个数
    B = fh-fl
    Fb = np.linspace(0,B,p+2)# 将频率等间隔
    #print(Fb)
    W2 = int(nfft / 2 + 1)
    df = fs/nfft
    freq = []#采样频率值
    for n in range(0,W2):
        freqs = int(n*df)
        freq.append(freqs)
    bank = np.zeros((p,W2))
    for k in range(1,p+1):
        f1 = Fb[k-1]
        f2 = Fb[k+1]
        f0 = Fb[k]
        n1=np.floor(f1/df)
        n2=np.floor(f2/df)
        n0=np.floor(f0/df)
        for i in range(1,W2):
            if i>=n1 and i<=n0:
                bank[k-1,i]=(i-n1)/(n0-n1)
            elif i>n0 and i<=n2:
                bank[k-1,i]=(n2-i)/(n2-n0)


        plt.plot(freq,bank[k-1,:],'r')
    plt.xlabel("Frequency(Hz)")
    plt.ylabel("Filter weighting")
    plt.show()


if __name__ == '__main__':
    audio_file = './phoneme/ps_1&ps_org_1/ps_org_1/a1_ps_org_1.wav_00:00:00.320000-00:00:00.380000.wav'
    y, sr = librosa.load(audio_file, sr=16000, mono=False)
    nfft = 512
    create_filter(sr, nfft, 0, sr / 2, 60)
2.使用均匀三角滤波器对音频信号进行过滤,得到各频段的能量谱。
bank = create_filter(sr, NFFT, 0, sr / 2, 60)
filter_banks = np.dot(pow_frames, bank.T) #pow_frames为原始音频的能量

from random import sample
import matplotlib.pyplot as plt
import librosa
import numpy as np
import python_speech_features as psf
import librosa
import librosa.display
import os
from scipy.fft import fft
# Step 1: 预加重
# Step 2: 分帧
# Step 3: 加窗
# Step 4: FFT
# Step 5: 幅值平方
# Step 6: 对数功率
plt.rcParams['font.sans-serif'] = ['Arial Unicode MS'] # 指定默认字体
plt.rcParams['axes.unicode_minus'] = False # 解决保存图像是负号'-'显示为方块的问题
##################################1.预加重################################
def preemphasis(signal, coeff=0.95):
return np.append(signal[1], signal[1:] - coeff * signal[:-1])
##################################2.均匀梅尔滤波器组################################
def create_filter(fs, nfft,fl, fh, count):
p = count #滤波器个数
B = fh-fl
Fb = np.linspace(0,B,p+2)# 将频率等间隔
# print(Fb)
W2 = int(nfft / 2 + 1)
df = fs/nfft
freq = []#采样频率值
for n in range(0,W2):
freqs = int(n*df)
freq.append(freqs)
bank = np.zeros((p,W2))
for k in range(1,p+1):
f1 = Fb[k-1]
f2 = Fb[k+1]
f0 = Fb[k]
n1=np.floor(f1/df)
n2=np.floor(f2/df)
n0=np.floor(f0/df)
for i in range(1,W2):
if i>=n1 and i<=n0:
bank[k-1,i]=(i-n1)/(n0-n1)
elif i>n0 and i<=n2:
bank[k-1,i]=(n2-i)/(n2-n0)
# plt.plot(freq,bank[k-1,:],'r')
# plt.xlabel("Frequency(Hz)")
# plt.ylabel("Filter weighting")
# plt.show()
return bank
if __name__ == '__main__':
dir=r"/Users/zhangxiao/lab_work/phoneme/ps_all/i2/"
filenames=os.listdir(dir)
filenames.sort()
for fileName in filenames:
if os.path.splitext(fileName)[1] == '.wav':
print(fileName)
audio_file = dir + fileName
y, sr = librosa.load(audio_file, sr=16000, mono=False)
time = len(y) * 1.0 /sr
print("总秒数:",time)
#信号采样总数
tmax = time
tmin = 0
n = int((tmax-tmin)*sr) #信号一共的sample数量
#预加重前的信号频谱
freq = sr/n * np.linspace(0,int(n/2),int(n/2)+1)
print("频率长度",len(freq))
#预加重
emphasized_y = preemphasis(y, coeff=0.98)
#预加重后的信号频谱
plt.plot(freq, np.absolute(np.fft.rfft(emphasized_y,n)**2)/n)
plt.xlim(0,8000)
plt.title(fileName.split('.')[0]+'预加重后语音信号频谱图')
plt.xlabel('Frequency/Hz',fontsize=14)
plt.show()
# plt.savefig(path + fileName.split('_')[0]+'语音信号频谱图')
plt.close()
#分帧
frame_size, frame_stride = 0.025,0.01
frame_length, frame_step = int(round(sr*frame_size)),int(round(sr*frame_stride))
signal_length = (tmax-tmin)*sr
print("signal_length", signal_length)
frame_num = int(np.ceil((signal_length-frame_length)/frame_step))+1 #向上舍入
print("帧数", frame_num)
pad_frame =(frame_num-1)*frame_step + frame_length-signal_length #不足的部分补零
pad_y = np.append(emphasized_y,np.zeros(int(pad_frame)))
signal_len = signal_length+pad_frame
#加窗
indices = np.tile(np.arange(0, frame_length), (frame_num, 1)) + np.tile(
np.arange(0, frame_num * frame_step, frame_step), (frame_length, 1)).T
frames = pad_y[indices] #frame的每一行代表每一帧的sample值
print(frames.shape)
frames *= np.hamming(frame_length) #加hamming window 注意这里不是矩阵乘法
#求功率谱 将多帧的功率谱 进行拼接得到的功率谱
NFFT = 512 #frame_length=400,所以用512足够了
mag_frames = np.absolute(np.fft.rfft(frames,NFFT))
pow_frames = mag_frames**2/NFFT
print(pow_frames.shape)
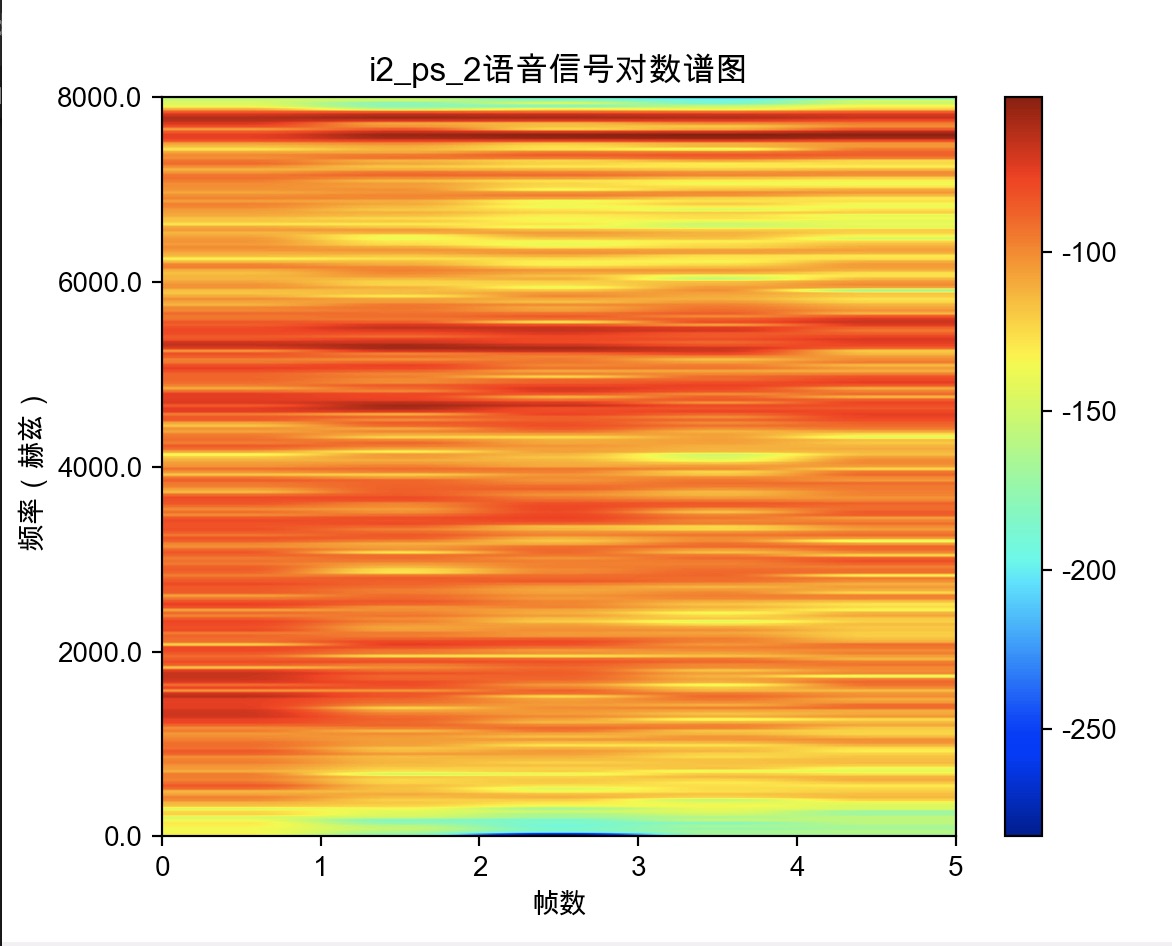
plt.imshow(20*np.log10(pow_frames.T), cmap=plt.cm.jet, aspect='auto', extent=(0, frame_num, 0, 256))
plt.yticks([0,64, 128, 192, 256], sr * np.array([0, 64, 128, 192, 256]) / NFFT)
plt.colorbar()
plt.title(fileName.split('.')[0]+'语音信号对数谱图')
plt.xlabel('帧数')
plt.ylabel('频率(赫兹)')
plt.show()
# plt.savefig(path + fileName.split('_')[0]+'语音信号对数谱图')
plt.close()
#均匀梅尔滤波
bank = create_filter(sr, NFFT, 0, sr / 2, 60)
filter_banks = np.dot(pow_frames, bank.T)
# filter_banks = np.where(filter_banks == 0, np.finfo(float).eps, filter_banks) #均值归一化
filter_banks = 20 * np.log10(filter_banks.T)
print(filter_banks.shape)
plt.imshow(filter_banks, cmap=plt.cm.jet, aspect='auto', extent=(0, frame_num, 0, 256))
plt.yticks([0,64, 128, 192, 256], sr * np.array([0, 64, 128, 192, 256]) / NFFT)
plt.colorbar()
plt.title(fileName.split('.')[0]+'滤波后的语音信号对数谱图')
plt.xlabel('帧数')
plt.ylabel('频率(赫兹)')
plt.show()
# plt.savefig(path + fileName.split('_')[0]+'语音信号对数谱图')
plt.close()

 浙公网安备 33010602011771号