python爬取福布斯富人榜并进行数据可视化
python爬取福布斯富人榜并进行数据可视化
一,选题背景
如今,人类社会已经进入了大数据时代,数据已经成为必不可少的部分,可见数据的获取非常重要,而数据的获取的方式大概有下面几种。
1、企业生产的数据,大型互联网公司有海量的用户,所以他们积累数据有天然的优势
2、数据管理资讯公司
3、政府/机构提供的公开数据
4、第三方数据平台购买数据爬虫爬取数据
二,爬虫设计方案
1、项目名称:python爬取福布斯富人榜并进行数据可视化
2、数据的获取与数据特点的分析
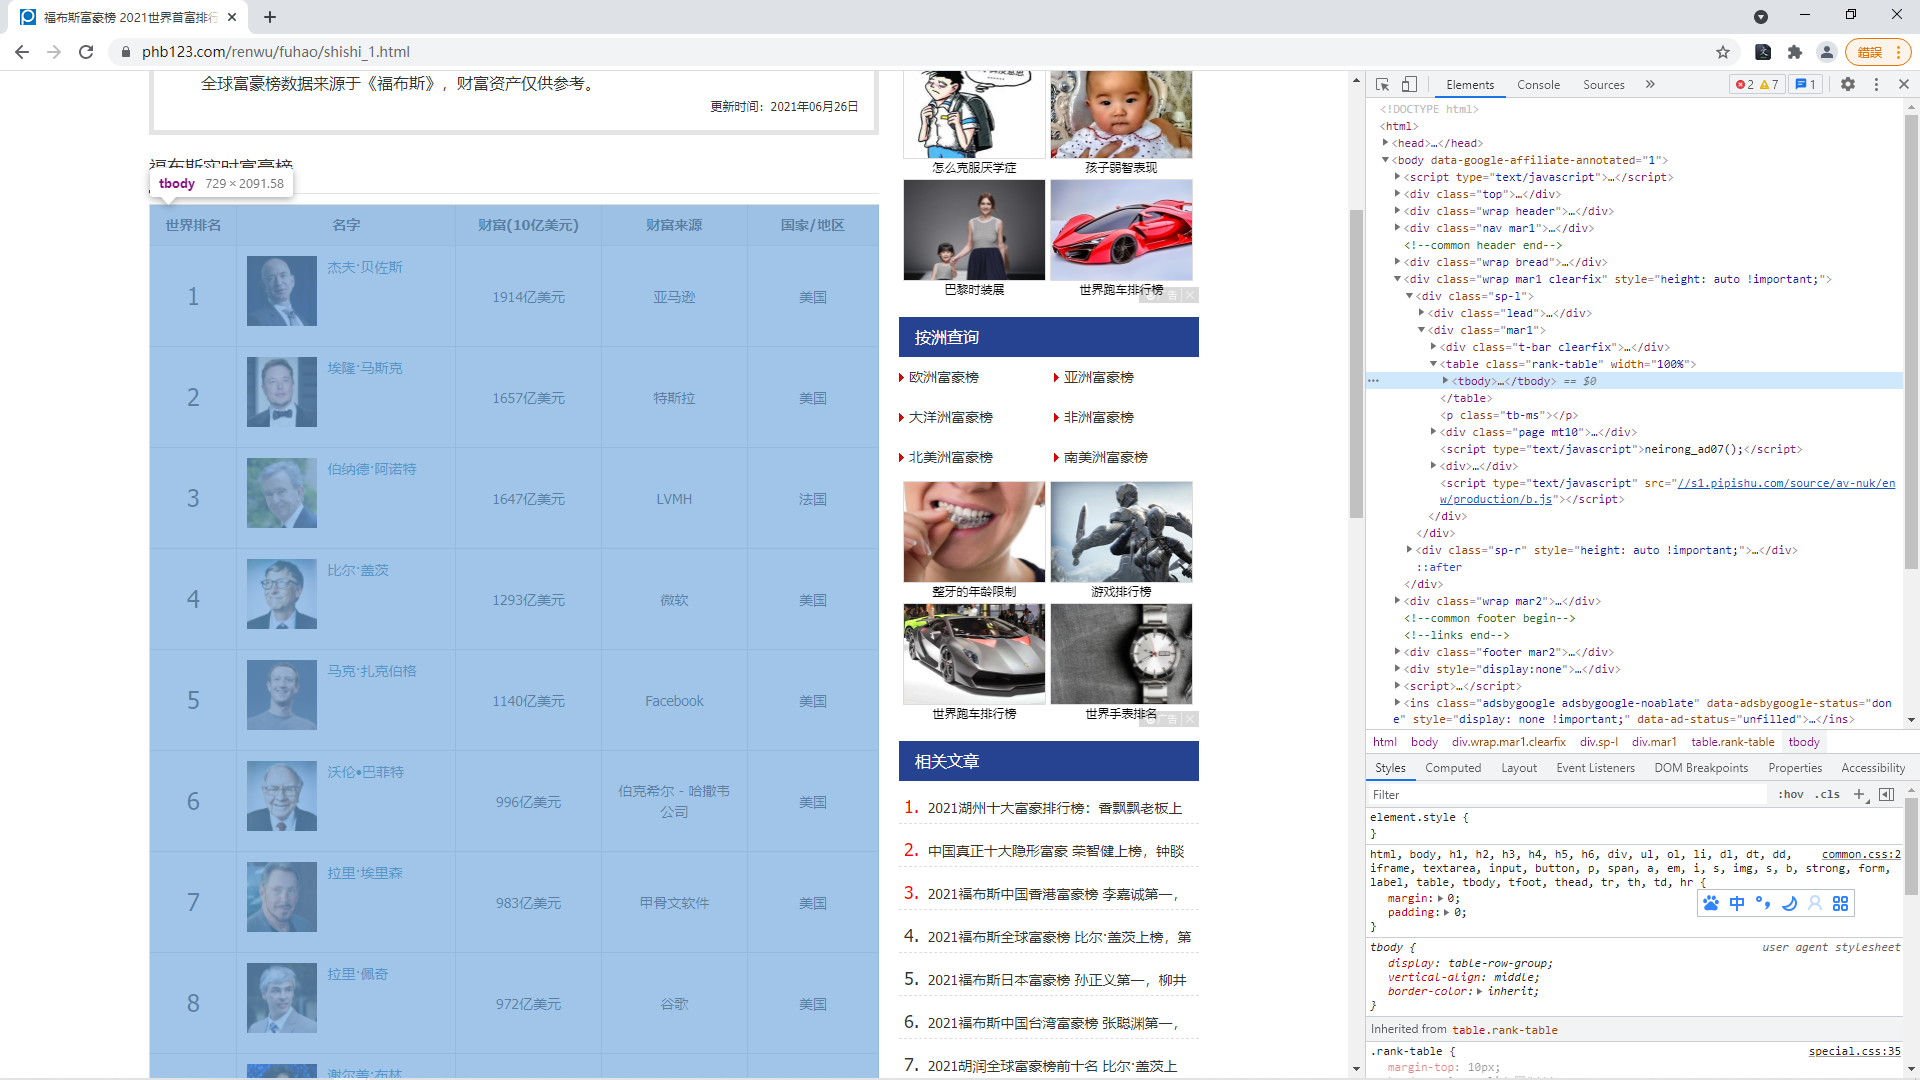
三,结构特征分析
1、页面解析:
四,程序设计
1、读取爬取页面链接结构
1 def loadalldata():
2    alldata = []
3    for i in range(1,16,1):
4       url = "https://www.phb123.com/renwu/fuhao/shishi_"+str(i)+".html"
5       data = loaddata(url)
6       alldata = alldata + data
7    return alldata
2、读取一页的数据
 1 def loaddata(url):
 2    from bs4 import BeautifulSoup
 3    import requests
 4    headers = {
 5        'User-Agent':'Mozilla/5.0 (Macintosh; Intel Mac OS X 10_14_3) AppleWebKit/537.36 (KHTML, like Gecko) '
 6                     'Chrome/72.0.3626.121 Safari/537.36'
 7    }
 8    f = requests.get(url,headers=headers)
 9    soup = BeautifulSoup(f.content, "lxml")
10    # print(f.content.decode())
11    ranktable = soup.find_all('table',class_="rank-table" )[0]
12    trlist = ranktable.find_all('tr')
13    trlist.pop(0)
14    persionlist = []
15    for tr in trlist:
16       persion = {}
17       persion['num'] = tr.find_all('td')[0].string
18       persion['name'] = tr.find_all('td')[1].p.string
19       persion['money'] = tr.find_all('td')[2].string
20       persion['company'] = tr.find_all('td')[3].string
21       persion['country'] = tr.find_all('td')[4].a.string
22       persionlist.append(persion)
23    print("页面"+url+"爬取成功")
24    return persionlist
3、将爬取到的数据保存到本地Excel文件
 1 def savedata(path,persionlist):
 2    import xlwt
 3    workbook = xlwt.Workbook()
 4    worksheet = workbook.add_sheet('test')
 5    worksheet.write(0, 0, '排名')
 6    worksheet.write(0, 1, '姓名')
 7    worksheet.write(0, 2, '财富')
 8    worksheet.write(0, 3, '企业')
 9    worksheet.write(0, 4, '国家')
10    for i in range(1,len(persionlist)+1,1):
11       worksheet.write(i, 0, persionlist[i-1]['num'])
12       worksheet.write(i, 1, persionlist[i-1]['name'])
13       worksheet.write(i, 2, persionlist[i-1]['money'])
14       worksheet.write(i, 3, persionlist[i-1]['company'])
15       worksheet.write(i, 4, persionlist[i-1]['country'])
16    workbook.save(path)
17    print("数据保存成功:"+path)
4、取出排行榜前十的姓名和财富数据 以两个list返回
 1 def loadtop10(path):
 2     import xlrd
 3     book = xlrd.open_workbook(path)
 4     sheet1 = book.sheets()[0]
 5     namelist = sheet1.col_values(1)
 6     moneylist = sheet1.col_values(2)
 7     namelist = namelist[1:11]
 8     moneylist = moneylist[1:11]
 9
10     moneylist2 = []
11     for a in moneylist:
12         a = int(a[0:-3])
13         moneylist2.append(a)
14     print("取出排行榜前十的姓名和财富数据")
15     print(namelist)
16     print(moneylist2)
17     return namelist,moneylist2
18 def countcountrynum(path):
19    import xlrd
20    book = xlrd.open_workbook(path)
21    sheet1 = book.sheets()[0]
22    countrylist = sheet1.col_values(4)[1:-1]
23    print(countrylist)
24    countryset = list(set(countrylist))
25    dictlist = []
26    for country in countryset:
27       obj = {"name":country,"count":0}
28       dictlist.append(obj)
29    for obj in dictlist:
30       for a in countrylist:
31          if obj['name'] == a:
32             obj['count'] = obj['count'] + 1
33    print(dictlist)
34    for i in range(0,len(dictlist),1):
35       for j in range(0,len(dictlist)-i-1,1):
36           if dictlist[j]['count'] < dictlist[j+1]['count']:
37              temp = dictlist[j]
38              dictlist[j] = dictlist[j+1]
39              dictlist[j+1] = temp
40    dictlist2 = dictlist[0:5]
41    set2 = []
42    for a in dictlist2:
43       set2.append(a['name'])
44    othercount = 0;
45    for a in dictlist:
46       if a['name'] not in set2:
47          othercount = othercount + 1
48    dictlist2.append({"name":"其他","count":othercount})
49    print('获取排行榜中每个国家的上榜人数')
50    print(dictlist2)
51    return dictlist2
52 def drow():
53    import matplotlib.pyplot as plt
54    plt.rcParams['font.sans-serif'] = ['SimHei']
55    plt.figure('福布斯前十榜',figsize=(15,5))
56    listx,listy = loadtop10('rank.xls')
57    plt.title('福布斯前十榜', fontsize=16)
58    plt.xlabel('人物', fontsize=14)
59    plt.ylabel('金额/亿美元', fontsize=14)
60    plt.tick_params(labelsize=10)
61    plt.grid(linestyle=':', axis='y')
62    a = plt.bar(listx, listy, color='dodgerblue', label='Apple', align='center')
63    for i in a:
64       h = i.get_height()
65       plt.text(i.get_x() + i.get_width() / 2, h, '%d' % int(h), ha='center', va='bottom')
66    dictlist = countcountrynum("rank.xls")
67    plt.figure('各国家上榜人数所占比例')
68    labels = []
69    sizes = []
70    for a in dictlist:
71       labels.append(a['name'])
72       sizes.append(a['count'])
73    explode = (0.1, 0, 0, 0, 0, 0)
74    plt.pie(sizes, explode=explode, labels=labels, autopct='%1.1f%%', shadow=False, startangle=150)
75    plt.title("各国家上榜人数所占比例", fontsize=16)
76    plt.axis('equal')
77
78    plt.show()
5、完整代码
  1  ## 读取一页的数据
  2 def loaddata(url):
  3    from bs4 import BeautifulSoup
  4    import requests
  5    headers = {
  6        'User-Agent':'Mozilla/5.0 (Macintosh; Intel Mac OS X 10_14_3) AppleWebKit/537.36 (KHTML, like Gecko) '
  7                     'Chrome/72.0.3626.121 Safari/537.36'
  8    }
  9    f = requests.get(url,headers=headers)   #Get该网页从而获取该html内容
 10    soup = BeautifulSoup(f.content, "lxml")  #用lxml解析器解析该网页的内容, 好像f.text也是返回的html
 11    # print(f.content.decode())        #尝试打印出网页内容,看是否获取成功
 12    ranktable = soup.find_all('table',class_="rank-table" )[0]   #获取排行榜表格
 13    trlist = ranktable.find_all('tr') #获取表格中所有tr标签
 14    trlist.pop(0) #去掉第一个元素
 15    persionlist = []
 16    for tr in trlist:
 17       persion = {}
 18       persion['num'] = tr.find_all('td')[0].string  #编号
 19       persion['name'] = tr.find_all('td')[1].p.string #名称
 20       persion['money'] = tr.find_all('td')[2].string #财产
 21       persion['company'] = tr.find_all('td')[3].string #企业
 22       persion['country'] = tr.find_all('td')[4].a.string #国家
 23       persionlist.append(persion)
 24    print("页面"+url+"爬取成功")
 25    return persionlist
 26
 27
 28 ## 读取所有福布斯排行榜数据
 29 def loadalldata():
 30    alldata = []
 31    for i in range(1,16,1):
 32       url = "https://www.phb123.com/renwu/fuhao/shishi_"+str(i)+".html"
 33       data = loaddata(url)
 34       alldata = alldata + data
 35    return alldata
 36
 37 ## 将爬取的数据保存到文件
 38 def savedata(path,persionlist):
 39    import xlwt
 40    workbook = xlwt.Workbook()
 41    worksheet = workbook.add_sheet('test')
 42    worksheet.write(0, 0, '排名')
 43    worksheet.write(0, 1, '姓名')
 44    worksheet.write(0, 2, '财富')
 45    worksheet.write(0, 3, '企业')
 46    worksheet.write(0, 4, '国家')
 47    for i in range(1,len(persionlist)+1,1):
 48       worksheet.write(i, 0, persionlist[i-1]['num'])
 49       worksheet.write(i, 1, persionlist[i-1]['name'])
 50       worksheet.write(i, 2, persionlist[i-1]['money'])
 51       worksheet.write(i, 3, persionlist[i-1]['company'])
 52       worksheet.write(i, 4, persionlist[i-1]['country'])
 53    workbook.save(path)
 54    print("数据保存成功:"+path)
 55
 56 ## 取出排行榜前十的姓名和财富数据 以两个list返回
 57 def loadtop10(path):
 58     import xlrd
 59     book = xlrd.open_workbook(path)
 60     sheet1 = book.sheets()[0]
 61     namelist = sheet1.col_values(1)
 62     moneylist = sheet1.col_values(2)
 63     namelist = namelist[1:11]
 64     moneylist = moneylist[1:11]
 65
 66     moneylist2 = []
 67     for a in moneylist:
 68         a = int(a[0:-3])
 69         moneylist2.append(a)
 70     print("取出排行榜前十的姓名和财富数据")
 71     print(namelist)
 72     print(moneylist2)
 73     return namelist,moneylist2
 74
 75 ## 统计排行榜中每个国家的上榜人数 以字典list返回
 76 def countcountrynum(path):
 77    import xlrd
 78    book = xlrd.open_workbook(path)
 79    sheet1 = book.sheets()[0]
 80    countrylist = sheet1.col_values(4)[1:-1]
 81    print(countrylist)
 82    countryset = list(set(countrylist))
 83    dictlist = []
 84    for country in countryset:
 85       obj = {"name":country,"count":0}
 86       dictlist.append(obj)
 87    ## 统计出每个国家对应的数量
 88    for obj in dictlist:
 89       for a in countrylist:
 90          if obj['name'] == a:
 91             obj['count'] = obj['count'] + 1
 92    print(dictlist)
 93    ## 将dictlist排序 数量多的放前面 8 5 6 9 3 2 4
 94    for i in range(0,len(dictlist),1):
 95       for j in range(0,len(dictlist)-i-1,1):
 96           if dictlist[j]['count'] < dictlist[j+1]['count']:
 97              temp = dictlist[j]
 98              dictlist[j] = dictlist[j+1]
 99              dictlist[j+1] = temp
100    dictlist2 = dictlist[0:5]
101    set2 = []
102    for a in dictlist2:
103       set2.append(a['name'])
104    othercount = 0;
105    for a in dictlist:
106       if a['name'] not in set2:
107          othercount = othercount + 1
108    dictlist2.append({"name":"其他","count":othercount})
109    print('获取排行榜中每个国家的上榜人数')
110    print(dictlist2)
111    return dictlist2
112
113 ## 绘制条形图和饼状图
114 def drow():
115    import matplotlib.pyplot as plt
116    plt.rcParams['font.sans-serif'] = ['SimHei'] # 设置中文字体
117    plt.figure('福布斯前十榜',figsize=(15,5))
118
119    ## 读取福布斯排行榜前十的数据
120    listx,listy = loadtop10('rank.xls')
121
122    plt.title('福布斯前十榜', fontsize=16)
123    plt.xlabel('人物', fontsize=14)
124    plt.ylabel('金额/亿美元', fontsize=14)
125    plt.tick_params(labelsize=10)
126    plt.grid(linestyle=':', axis='y')
127    a = plt.bar(listx, listy, color='dodgerblue', label='Apple', align='center')
128    # 设置标签
129    for i in a:
130       h = i.get_height()
131       plt.text(i.get_x() + i.get_width() / 2, h, '%d' % int(h), ha='center', va='bottom')
132    ## -------------------------------------------------------------------------
133    dictlist = countcountrynum("rank.xls")
134    plt.figure('各国家上榜人数所占比例')
135    labels = []
136    sizes = []
137    for a in dictlist:
138       labels.append(a['name'])
139       sizes.append(a['count'])
140    explode = (0.1, 0, 0, 0, 0, 0)
141    plt.pie(sizes, explode=explode, labels=labels, autopct='%1.1f%%', shadow=False, startangle=150)
142    plt.title("各国家上榜人数所占比例", fontsize=16)
143    plt.axis('equal')  # 该行代码使饼图长宽相等
144
145    plt.show()
146
147 if __name__ == '__main__':
148
149    ## 爬取数据
150    data = loadalldata()
151    ## 保存数据
152    savedata("rank.xls",data)    # py文件同级目录创建rank.xls文件
153    ## 展示数据
154    drow()
五,效果实现
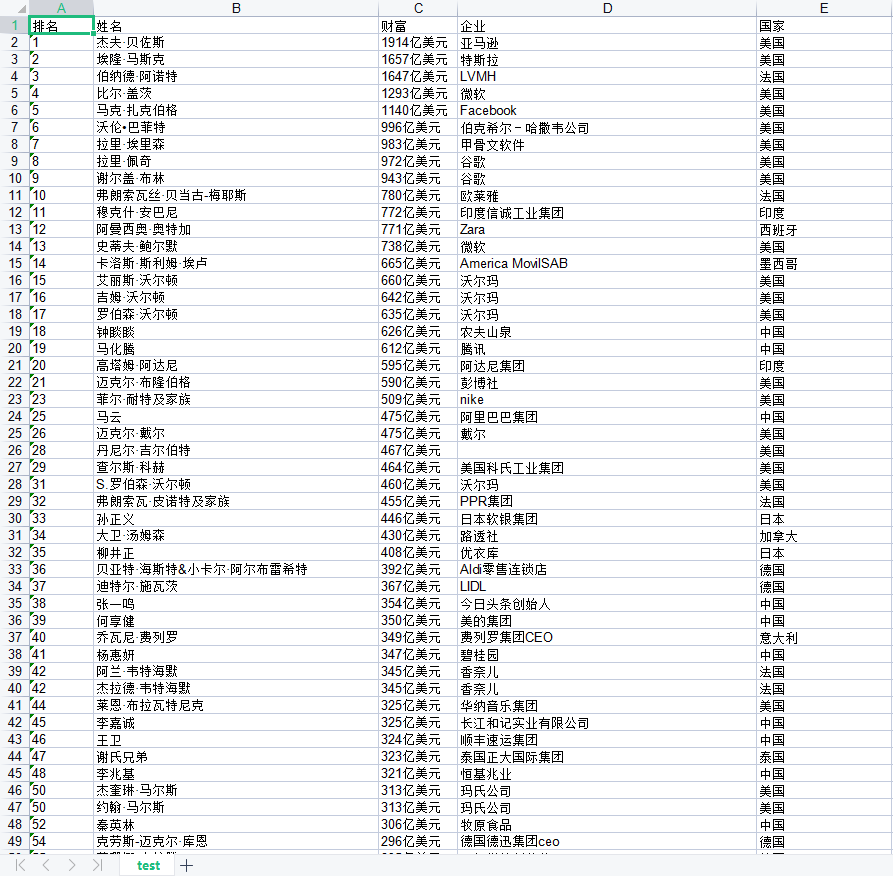
1、获取到数据的本地Excel文件
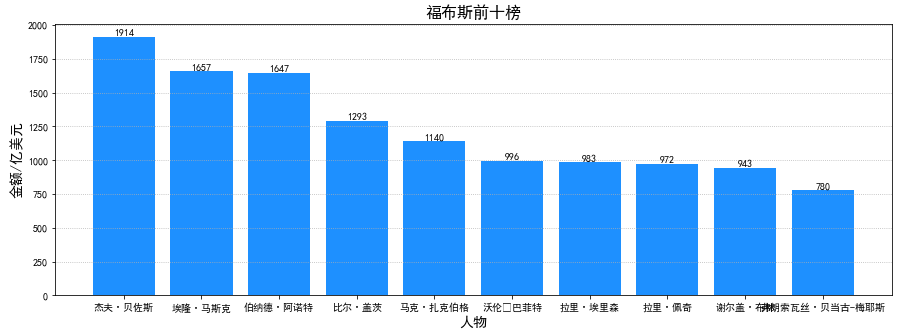
2、福布斯排行榜前十的人物数据可视化效果
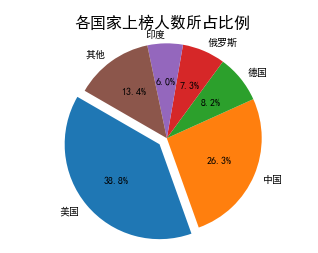
3、各个国家上榜人数与整体相比所占比例的统计与可视化
六,项目总结
1、得到的结论
根据饼图发现,美国上榜人数最多,然后中国紧随其后,其次是德国、俄罗斯、印度……等等国家。根据柱状图发现,福布斯排行榜的大部分都所属美国,只有第三位与第十位是法国人。
2、收获
这次爬虫项目的设计与实施让我学会了爬取网站的信息与获取的数据分析。因为这次的项目就很不熟练导致到处碰壁,所以需要学会的知识点还有很多,还需要不断的学习与改进。

 浙公网安备 33010602011771号