arcgis for js4.x实现标记、测距离、测面积
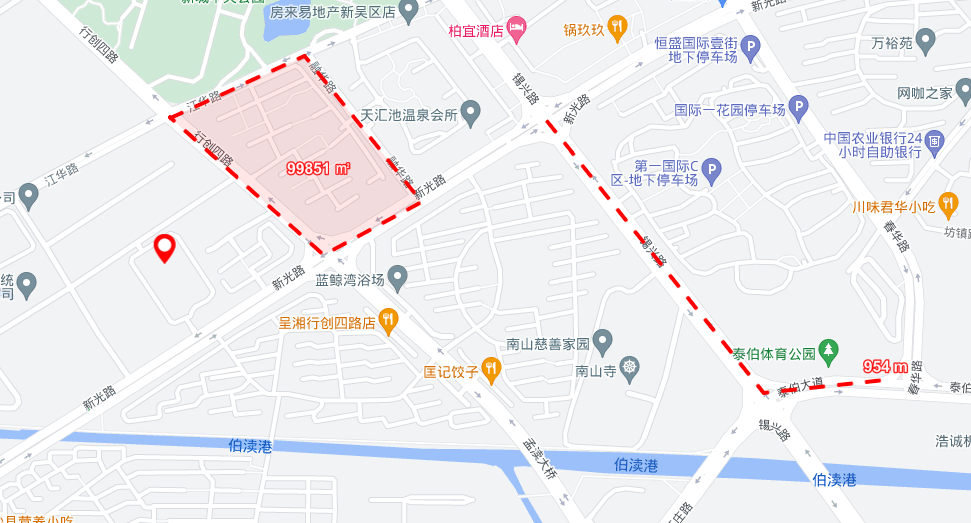
实现效果
代码如下
ToolBox.vue
<template>
  <a-popover trigger="click">
    <a-button>工具箱</a-button>
    <template #content>
      <a-button type="text" class="btn" @click="() => enableCreatePoint(draw, mapView)">
        <template #icon>
          <icon-location />
        </template>
        <template #default>标记</template>
      </a-button>
      <br />
      <a-button type="text" class="btn" @click="() => enableCreateLine(draw, mapView)">
        <template #icon>
          <icon-edit />
        </template>
        <template #default>测距离</template>
      </a-button>
      <br />
      <a-button type="text" class="btn" @click="() => enableCreateArea(draw, mapView)">
        <template #icon>
          <icon-paste />
        </template>
        <template #default>测面积</template>
      </a-button>
      <br />
      <a-button type="text" class="btn" @click="() => clearAll()">
        <template #icon>
          <icon-delete />
        </template>
        <template #default>清除</template>
      </a-button>
    </template>
  </a-popover>
</template>

<script setup lang="ts">
import { onMounted } from 'vue'
import Global from '@/utils/global'
import { formatLength, formatArea } from '@/utils/utils'
import GraphicsLayer from '@arcgis/core/layers/GraphicsLayer'
import Graphic from '@arcgis/core/Graphic'
import Draw from '@arcgis/core/views/draw/Draw'
import Point from '@arcgis/core/geometry/Point'
import Polyline from '@arcgis/core/geometry/Polyline'
import Polygon from '@arcgis/core/geometry/Polygon'
import * as geometryEngine from '@arcgis/core/geometry/geometryEngine'
import * as projection from '@arcgis/core/geometry/projection'

import PointRedImg from '@/assets/images/pointRed.png'

const mapView = Global.map
let draw = new Draw({
  view: mapView
})
let pointLayer = new GraphicsLayer()
let lineLayer = new GraphicsLayer()
let areaLayer = new GraphicsLayer()
mapView.map.addMany([pointLayer, lineLayer, areaLayer])

//开始监听画点
const enableCreatePoint = (draw: any, view: any) => {
  const action = draw.create('point', {
    mode: 'click' //点击方式加点
  })
  // 获取焦点
  view.focus()

  // vertex-add 顶点添加事件 vertex-remove 顶点移除事件 draw-complete 绘制完成事件
  action.on(['vertex-add', 'vertex-remove', 'draw-complete'], createPoint)
}

// 开始监听画线
const enableCreateLine = (draw: any, view: any) => {
  const action = draw.create('polyline', {
    mode: 'click'
  })
  // 获取焦点
  view.focus()

  // vertex-add 顶点添加事件 vertex-remove 顶点移除事件 cursor-update 鼠标移动事件 draw-complete 绘制完成事件
  action.on(['vertex-add', 'vertex-remove', 'cursor-update', 'draw-complete'], createPolyline)
}

//开始监听画面
const enableCreateArea = (draw: any, view: any) => {
  const action = draw.create('polygon', {
    mode: 'click' //点击方式加点
  })
  // 获取焦点
  view.focus()

  // vertex-add 顶点添加事件 vertex-remove 顶点移除事件 cursor-update 鼠标移动事件 draw-complete 绘制完成事件
  action.on(['vertex-add', 'vertex-remove', 'cursor-update', 'draw-complete'], createPolygon)
}

//根据点坐标生成新的点
const createPoint = (event: any) => {
  // console.log('event', event, mapView.spatialReference)
  //获取所有顶点
  const coordinates = event.coordinates

  // console.log('coordinates', coordinates)

  //生成绘制的图形
  const graphic = new Graphic({
    geometry: new Point({
      hasZ: false,
      hasM: false,
      x: coordinates[0],
      y: coordinates[1],
      spatialReference: mapView.spatialReference
    }),
    symbol: {
      type: 'picture-marker',
      url: PointRedImg,
      width: '30px',
      height: '30px',
      xoffset: '0px',
      yoffset: '15px'
    } as any
  })

  const { longitude, latitude } = projection.project(graphic.geometry, { wkid: 4326 }) as any
  // console.log('a', longitude, latitude)
  graphic.attributes = {
    id: 'point_marker.',
    poi: [longitude, latitude]
  }

  // 将绘制的图形添加到view
  pointLayer.add(graphic)
}

//根据点坐标生成新的线
const createPolyline = (event: any) => {
  //获取所有顶点
  const vertices = event.vertices
  //清除之前绘制
  lineLayer.removeAll()
  // 生成绘制的图形
  const graphic = new Graphic({
    geometry: new Polyline({
      paths: vertices,
      spatialReference: mapView.spatialReference
    }),
    symbol: {
      type: 'simple-line', // autocasts as new SimpleLineSymbol
      style: 'dash',
      color: '#ff0000',
      width: 3,
      cap: 'round',
      join: 'round'
    } as any
  })

  const output = getLineDistance(mapView, graphic.geometry)
  console.log('output', output)

  //设置总长度的显示样式,并添加到地图上
  const textSymbol = {
    type: 'text', // autocasts as new TextSymbol()
    color: 'white',
    haloColor: '#ff0000',
    haloSize: 1,
    // backgroundColor: [255, 0, 0, 0.75],
    // borderLineColor: 'red',
    // borderLineSize: 10,
    text: output,
    yoffset: '8px',
    font: {
      // autocasts as new Font()
      size: 12,
      weight: 'bold'
    }
  }

  const { paths } = projection.project(graphic.geometry, { wkid: 4326 }) as any

  const endPointPosition = paths[0]?.pop()
  const textGraphic = new Graphic({
    geometry: new Point({
      longitude: endPointPosition[0],
      latitude: endPointPosition[1]
    }),
    symbol: textSymbol
  })

  // 将绘制的图形添加到view
  lineLayer.addMany([graphic, textGraphic])
}

const createPolygon = (event: any) => {
  //获取所有顶点
  const vertices = event.vertices
  //清除之前绘制
  areaLayer.removeAll()

  // 生成绘制的图形
  const graphic = new Graphic({
    geometry: new Polygon({
      hasZ: false,
      hasM: false,
      rings: [vertices],
      spatialReference: mapView.spatialReference
    }),
    symbol: {
      type: 'simple-fill', // autocasts as new SimpleFillSymbol()
      color: [255, 0, 0, 0.1],
      style: 'solid',
      outline: {
        // autocasts as new SimpleLineSymbol()
        style: 'dash',
        color: '#ff0000',
        width: 3,
        cap: 'round',
        join: 'round'
      }
    } as any
  })

  const output = getAreaOutput(mapView, graphic.geometry)
  console.log('output', output)

  //设置总面积的显示样式,并添加到地图上
  const textSymbol = {
    type: 'text', // autocasts as new TextSymbol()
    color: 'white',
    haloColor: '#ff0000',
    haloSize: 1,
    text: output,
    // yoffset: '8px',
    font: {
      // autocasts as new Font()
      size: 12,
      weight: 'bold'
    }
  }

  const { longitude, latitude } = graphic.geometry.centroid
  // console.log('centerPoint', longitude, latitude)

  const textGraphic = new Graphic({
    geometry: new Point({
      longitude,
      latitude
    }),
    symbol: textSymbol
  })

  // 将绘制的图形添加到view
  areaLayer.addMany([graphic, textGraphic])
}

// 计算线的长度
const getLineDistance = (view: any, geometry: any) => {
  let distance = 0
  //根据参数,动态计算长度
  if (
    view.spatialReference.wkid == '3857' ||
    view.spatialReference.wkid == '102100' ||
    view.spatialReference.wkid == '4326'
  ) {
    //在web麦卡托投影和WGS84坐标系下的计算方法
    distance = geometryEngine.geodesicLength(geometry, 'meters') //geodesicArea适用坐标系见官网API
  } else {
    //在其他投影坐标系下的计算方法
    distance = geometryEngine.planarLength(geometry, 'meters') //planarArea适用于平面投影坐标系
  }

  return formatLength(distance)
}

// 计算所选区域面积
const getAreaOutput = (view: any, geometry: any) => {
  let area = 0
  //根据参数,动态计算长度
  if (
    view.spatialReference.wkid == '3857' ||
    view.spatialReference.wkid == '102100' ||
    view.spatialReference.wkid == '4326'
  ) {
    //在web麦卡托投影和WGS84坐标系下的计算方法
    area = geometryEngine.geodesicArea(geometry, 'square-meters') //geodesicArea适用坐标系见官网API
    if (area < 0) {
      // simplify the polygon if needed and calculate the area again
      const simplifiedPolygon: any = geometryEngine.simplify(geometry)
      if (simplifiedPolygon) {
        area = geometryEngine.geodesicArea(simplifiedPolygon, 'square-meters')
      }
    }
  } else {
    //在其他投影坐标系下的计算方法
    area = geometryEngine.planarArea(geometry, 'square-meters') //planarArea适用于平面投影坐标系
  }

  return formatArea(area)
}

// 清除
const clearAll = () => {
  pointLayer.removeAll()
  lineLayer.removeAll()
  areaLayer.removeAll()
}
</script>

<style scoped lang="less">
.btn {
  color: #222 !important;
}
</style>
utils.js
// 计算距离
export const formatLength = (length: number): string => {
  length = Math.round(length)
  let output
  if (length > 1000) {
    output = (length / 1000).toFixed(2) +
      ' ' + 'km'
  } else {
    output = length +
      ' ' + 'm'
  }
  return output
}

// 计算面积
export const formatArea = (area: number): string => {
  area = Math.round(area)
  let output
  if (area > 10000000) {
    output = (area / 1000000).toFixed(2) +
      ' ' + 'k㎡'
  } else {
    output = area +
      ' ' + '㎡'
  }
  return output
}

 浙公网安备 33010602011771号